Global Climate Change
GEOS 3410
Graham H. Edwards
Draw a number, return the number, and sit in the corresponding area.

Disclaimer
Class sessions are recorded and available on Canvas to support your learning.

Week 1 Schedule
Tuesday
- Welcome/introduction
- IPCC reading, discussion
- Course overview
- Climate intro
Thursday
- Syllabus overview
- Climate, cont...
Outside of class
- Complete (29 Aug): Onboarding survey on Canvas
- Complete (12 Sept): Quantitative skills practice set
This week's business
Syllabus
Please read the syllabus. If not for your own success in this course, then for Syllabus Trivia on Thursday.
If you never read the syllabus... (but please do!)
- Attend class (unless you should not or cannot)
- Drop-in hours – see me before you need me!
- Course schedule: 3 assessments, labs
- Please reach out if you are struggling.
Quantitative skills
- Complete practice packet
- Self-grade
- Meet with me (asar)
Skills packet
Laboratory 1: Climate science & data science
MMS 273 — Thursday 12:45–3:25 pm
- Bring a computer to lab (tablet unideal but ok)
- Complete pre-laboratory assignment before lab meeting
A little about me...
- Please call me "Graham"
- My pronouns are he/him
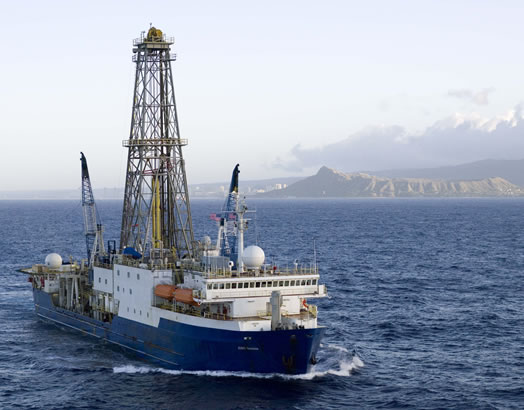
- I am a geochemist and cosmochemist
- I use analytical chemistry and numerical models to study…
- the histories of lakes and extinct ice sheets
- interaction between sediment/soil and water over long timescales
- the early evolution of the solar system
- I do not like driving
- I do like baking bread, biking, and long train rides
⚗️ Guiding framework ⚗️
Diving right in...
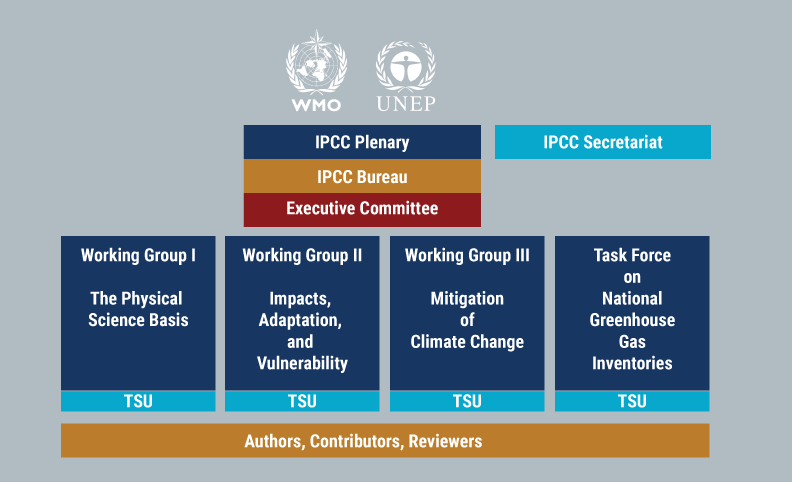
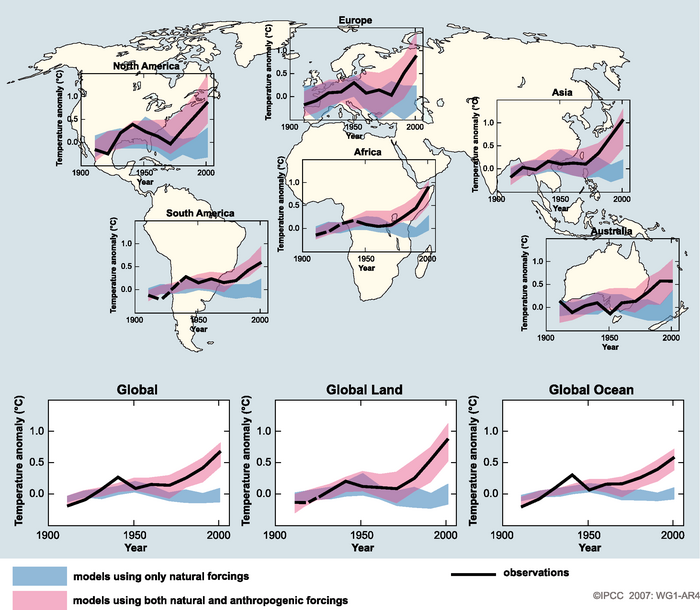
Intergovernmental Panel on Climate Change (IPCC)
Step 1: Collaborators
Your clustermates are your collaborators.
Introduce yourself and share these 4 pieces of information:
- Name, pronouns
- Year or major or both.
- Hometown (however you define it)
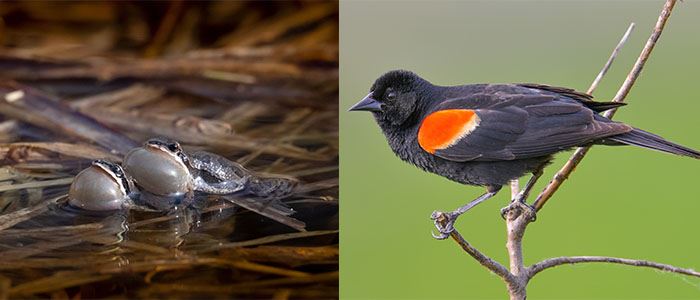
- Bird or frog?
Report back
🐸 & 🐦
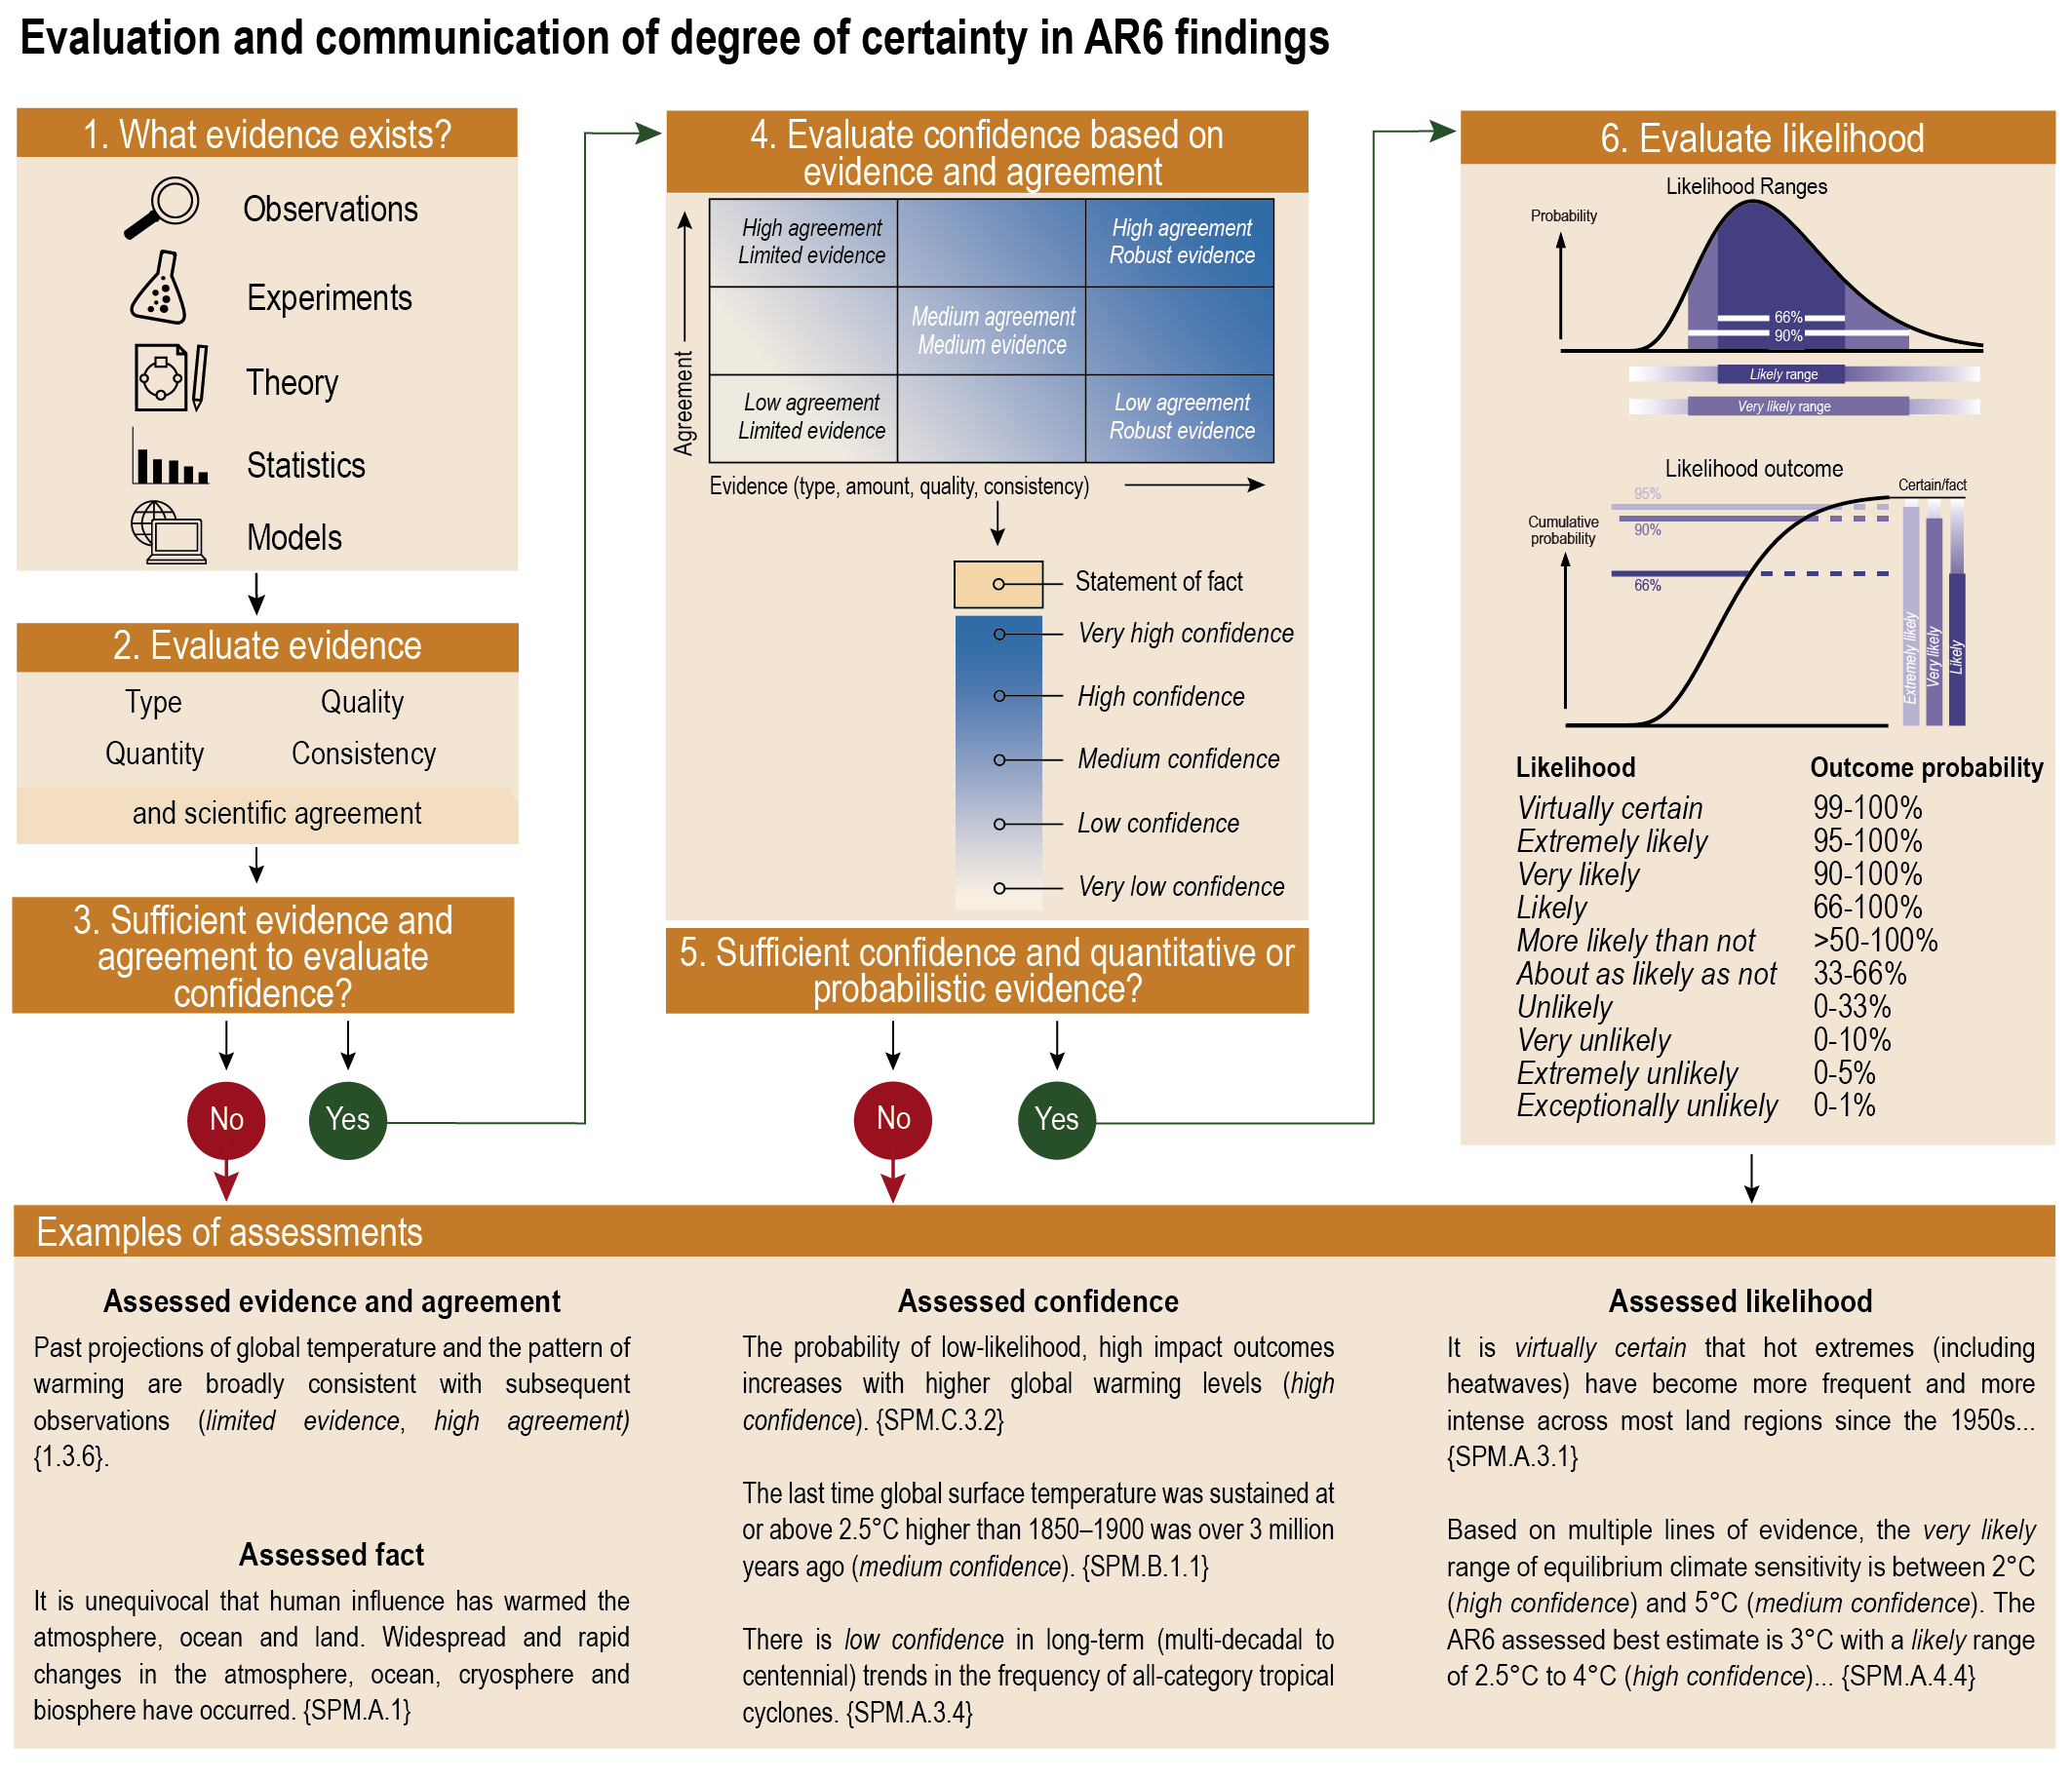
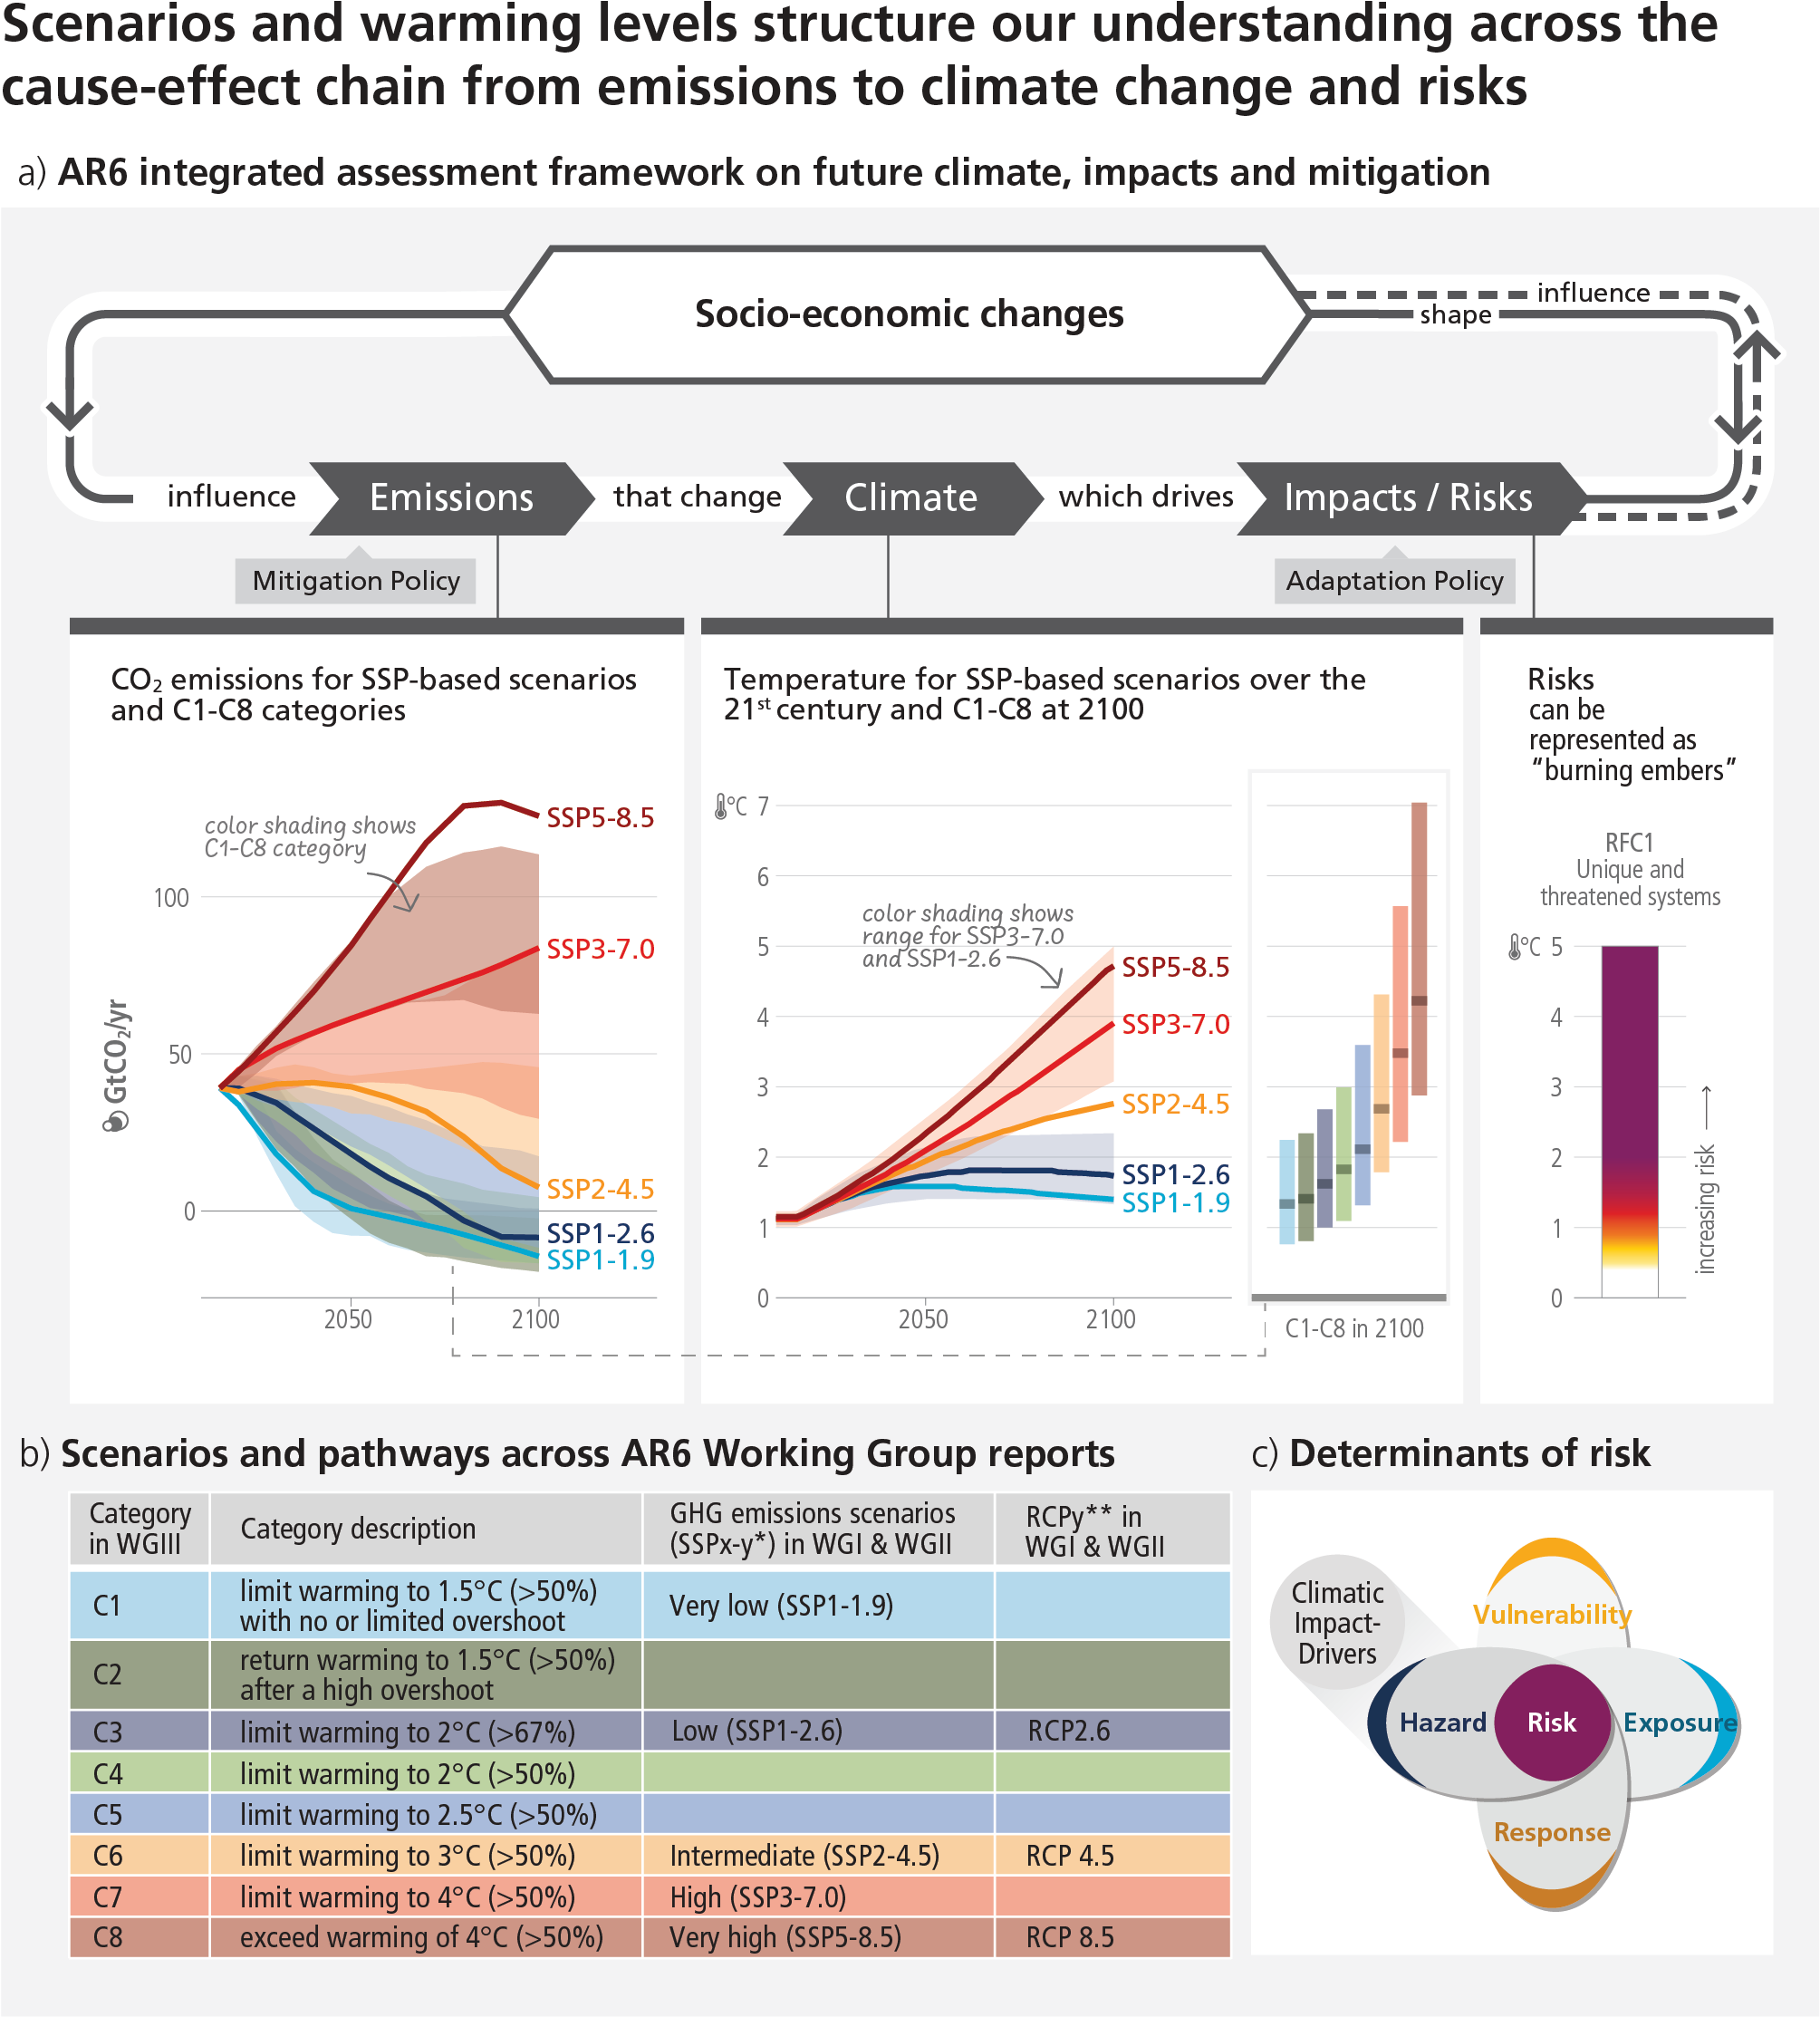
Step 2: Reading Assessment Report 6 (AR6)
Synthesis Report: Summary for Policymakers
-
Read through the excerpt on your table and discuss the following questions with your collaborators:
- What did you read that was familiar?
- What did you read that was unfamiliar?
- What new question(s) do you have after this reading?
- How did reading this make you feel?
Be prepared to share your reflections
Report back
Course Overview
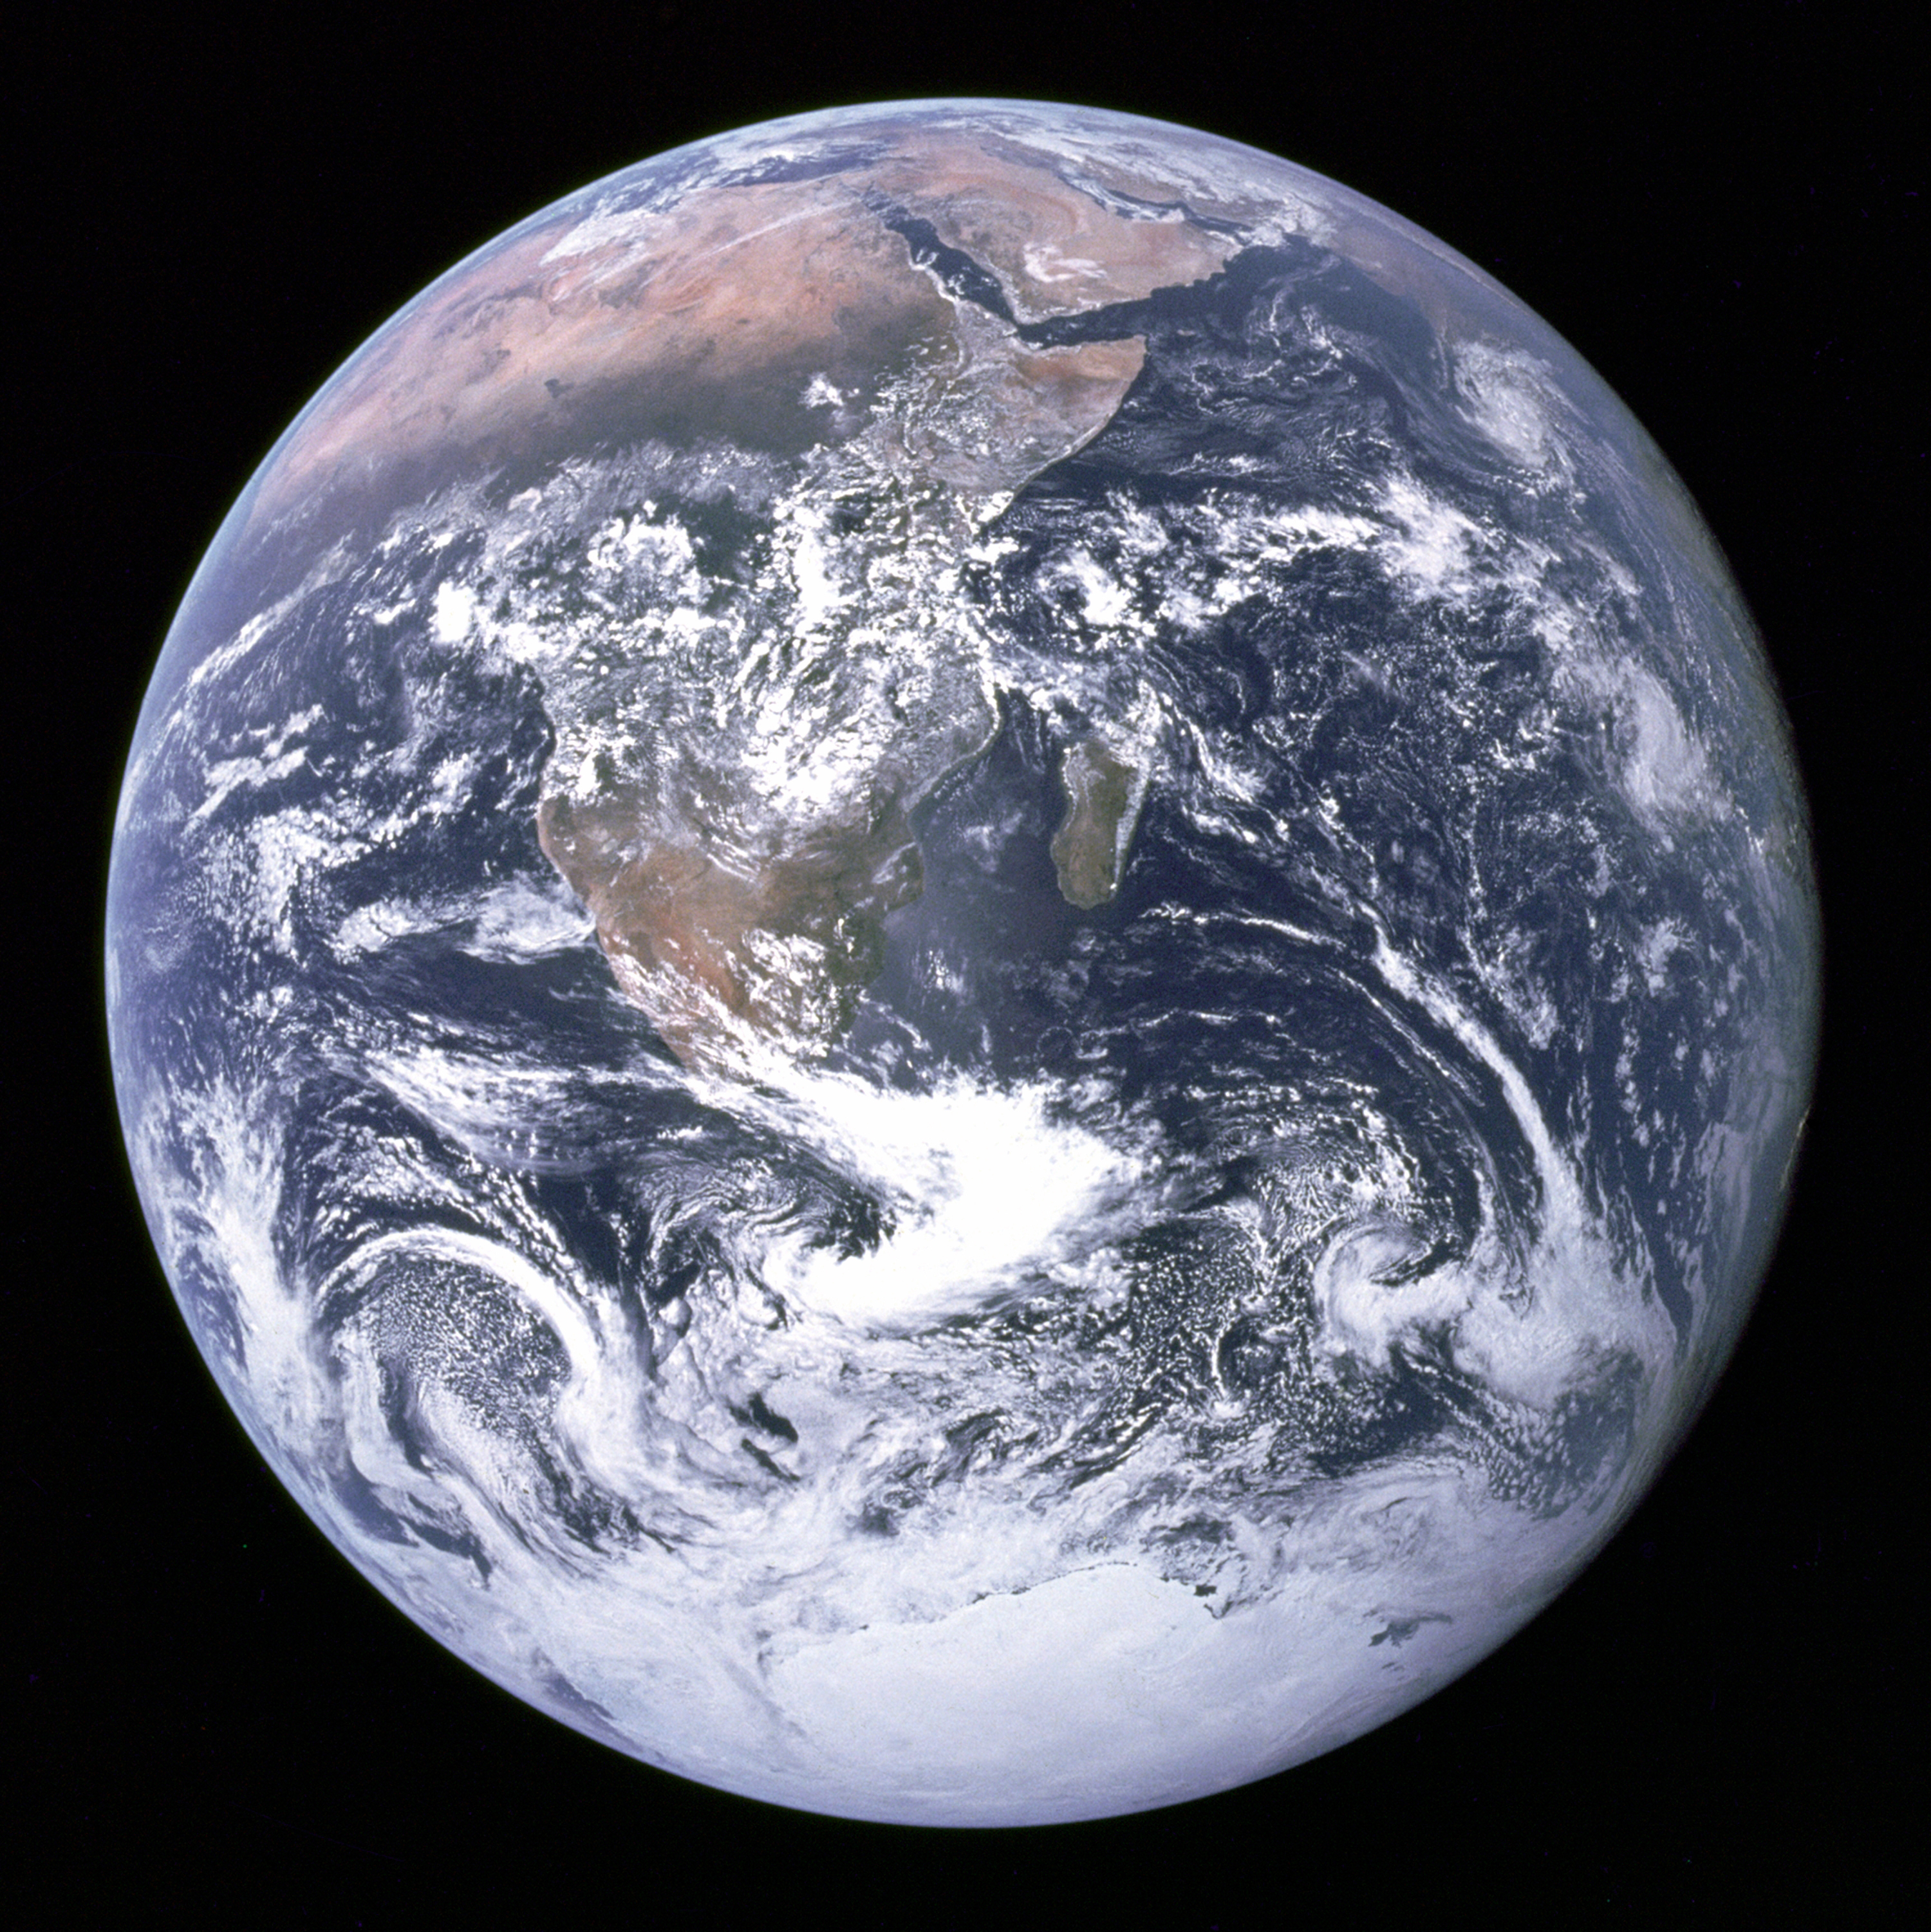
Two broad themes
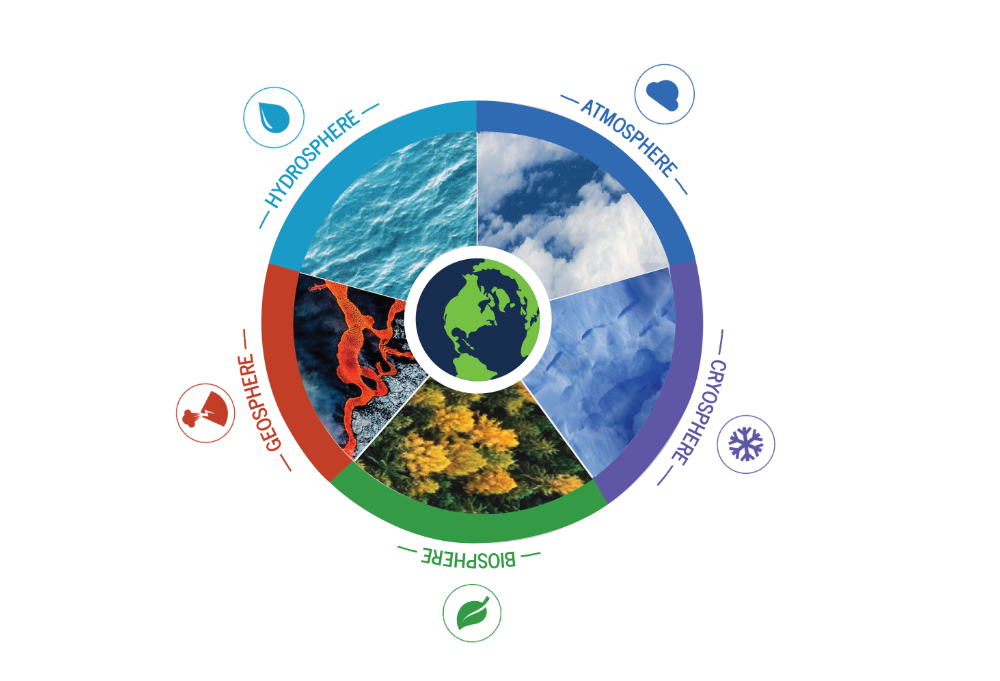
- The Earth (climate) system:
physics & foundations - Earth's climate through time:
past → present → future

Theme 1
The Earth (climate) system: physics & foundations
Week 1
Climate (science) & why we care

Week 2
The Earth (climate) system
Week 3
(Astro)Physics of climate

Week 4
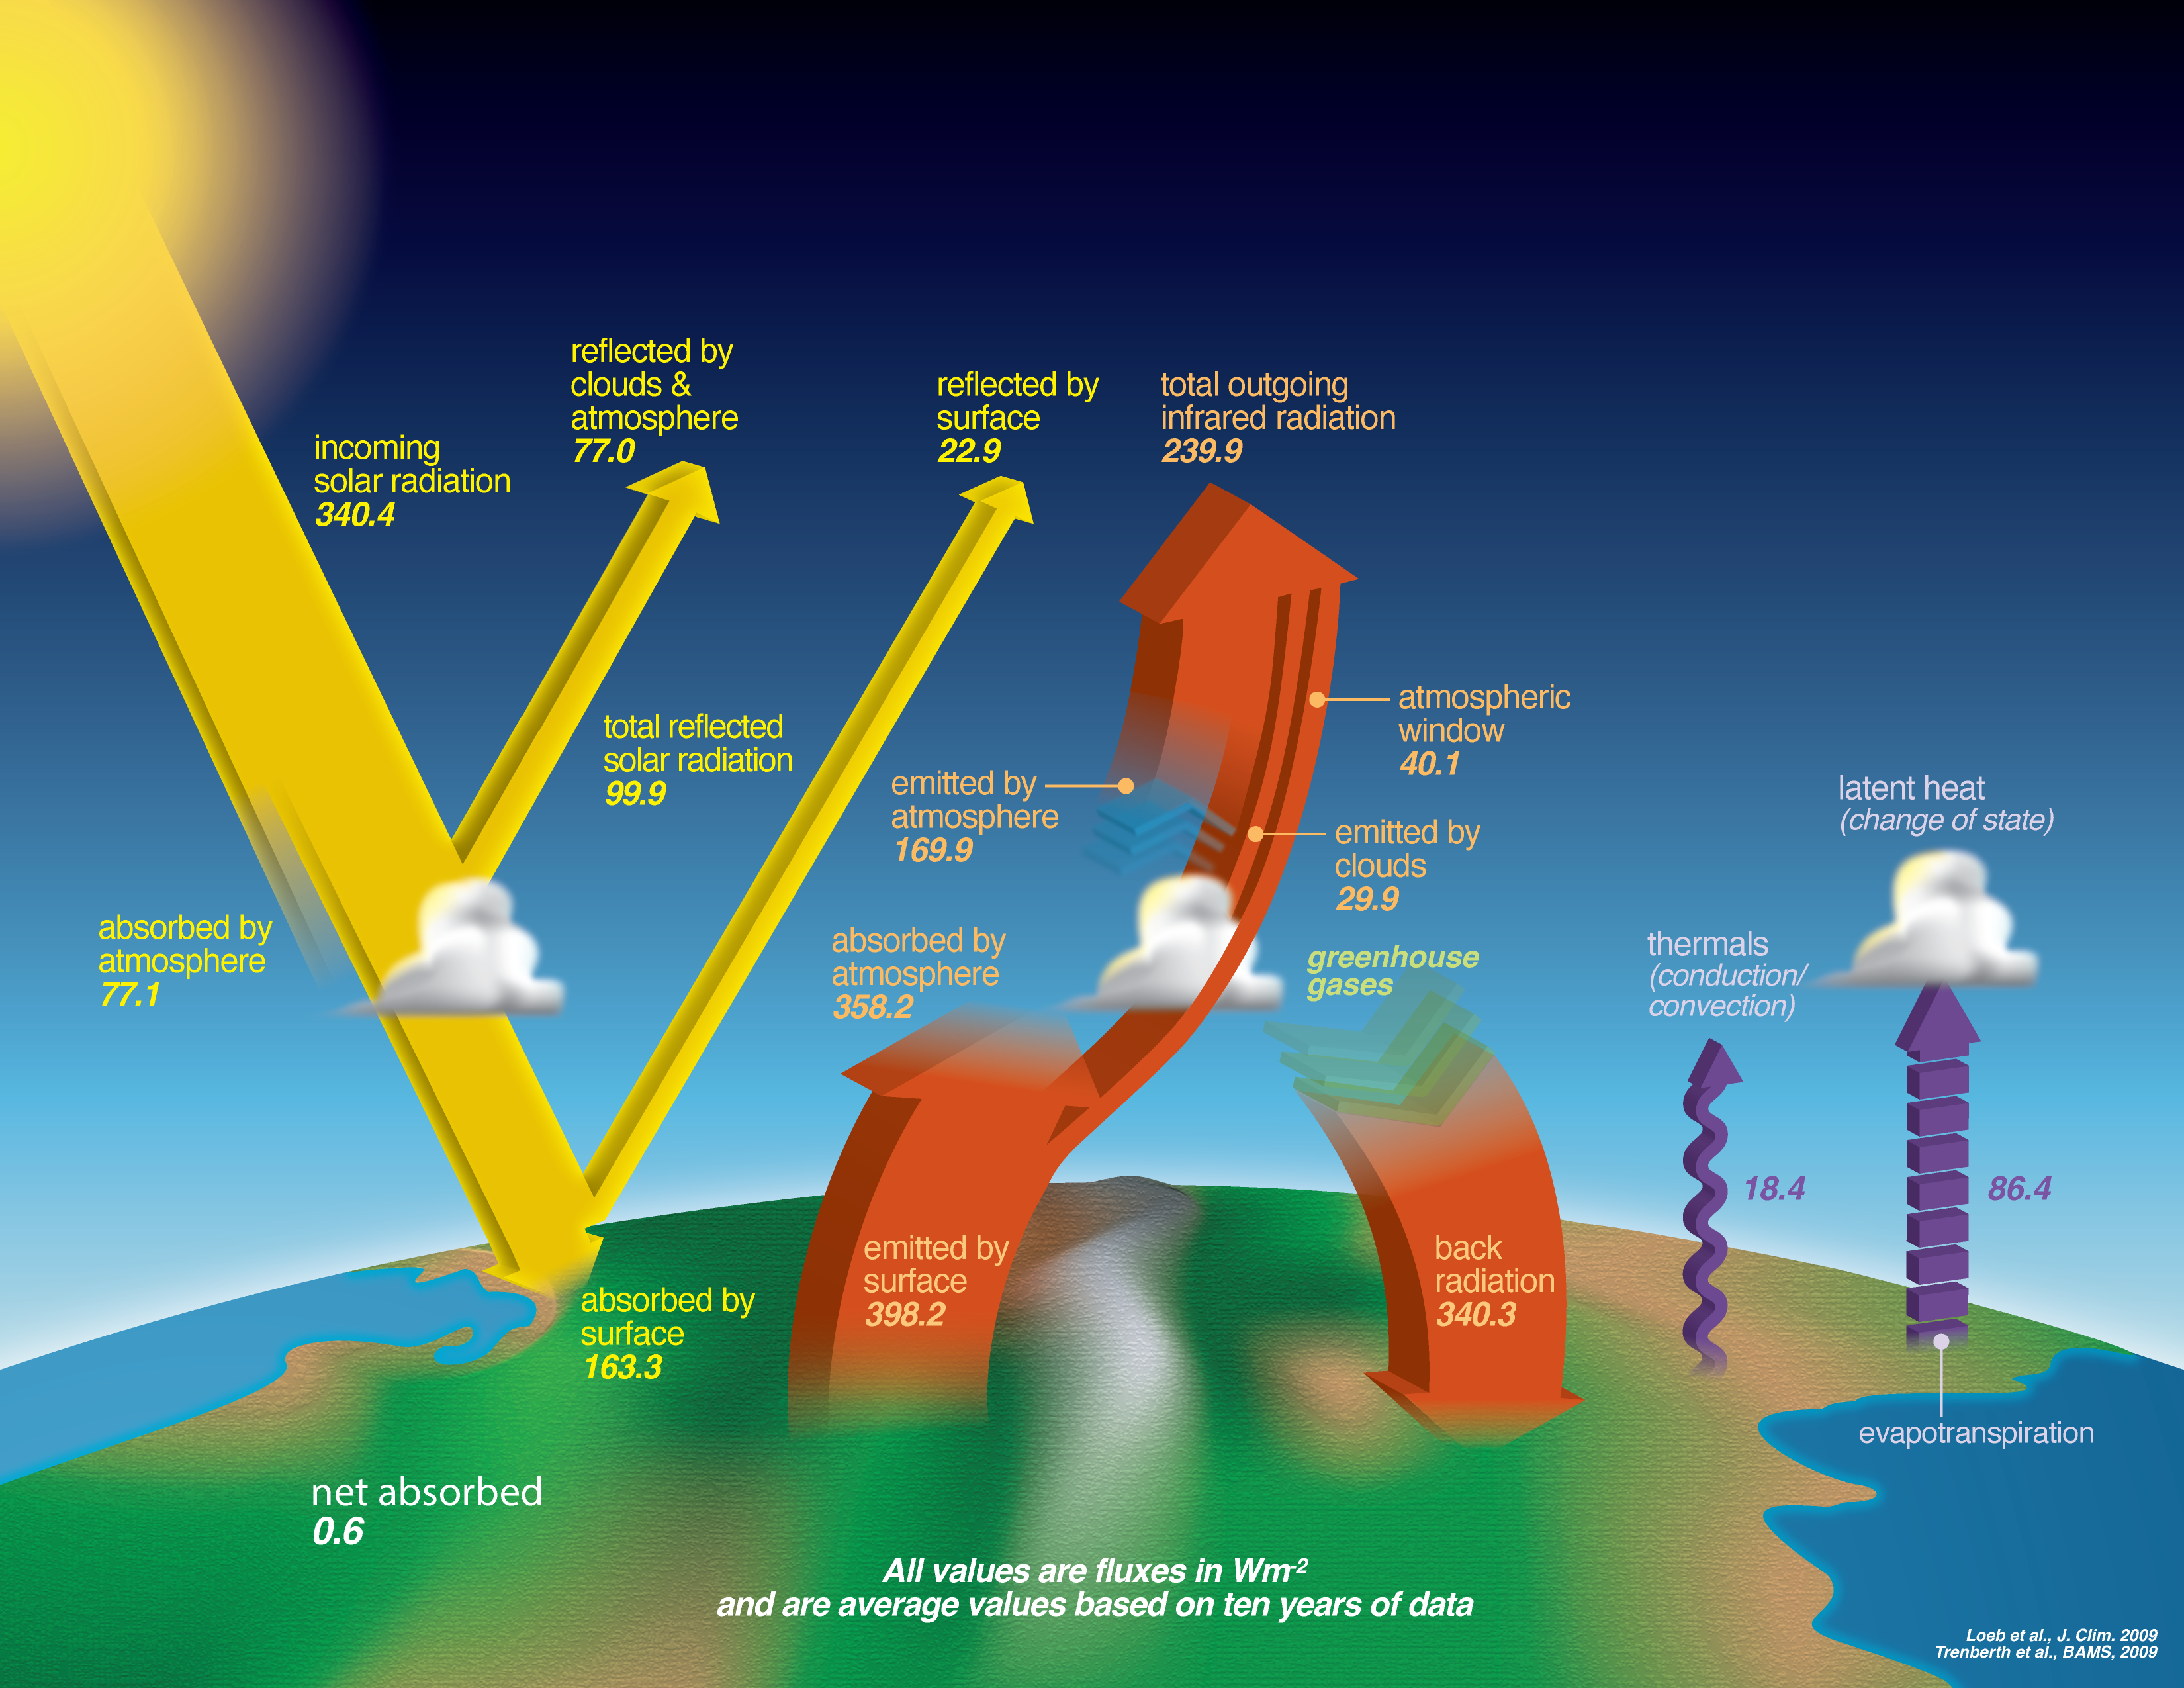
Energy budget & radiative forcing
Week 5
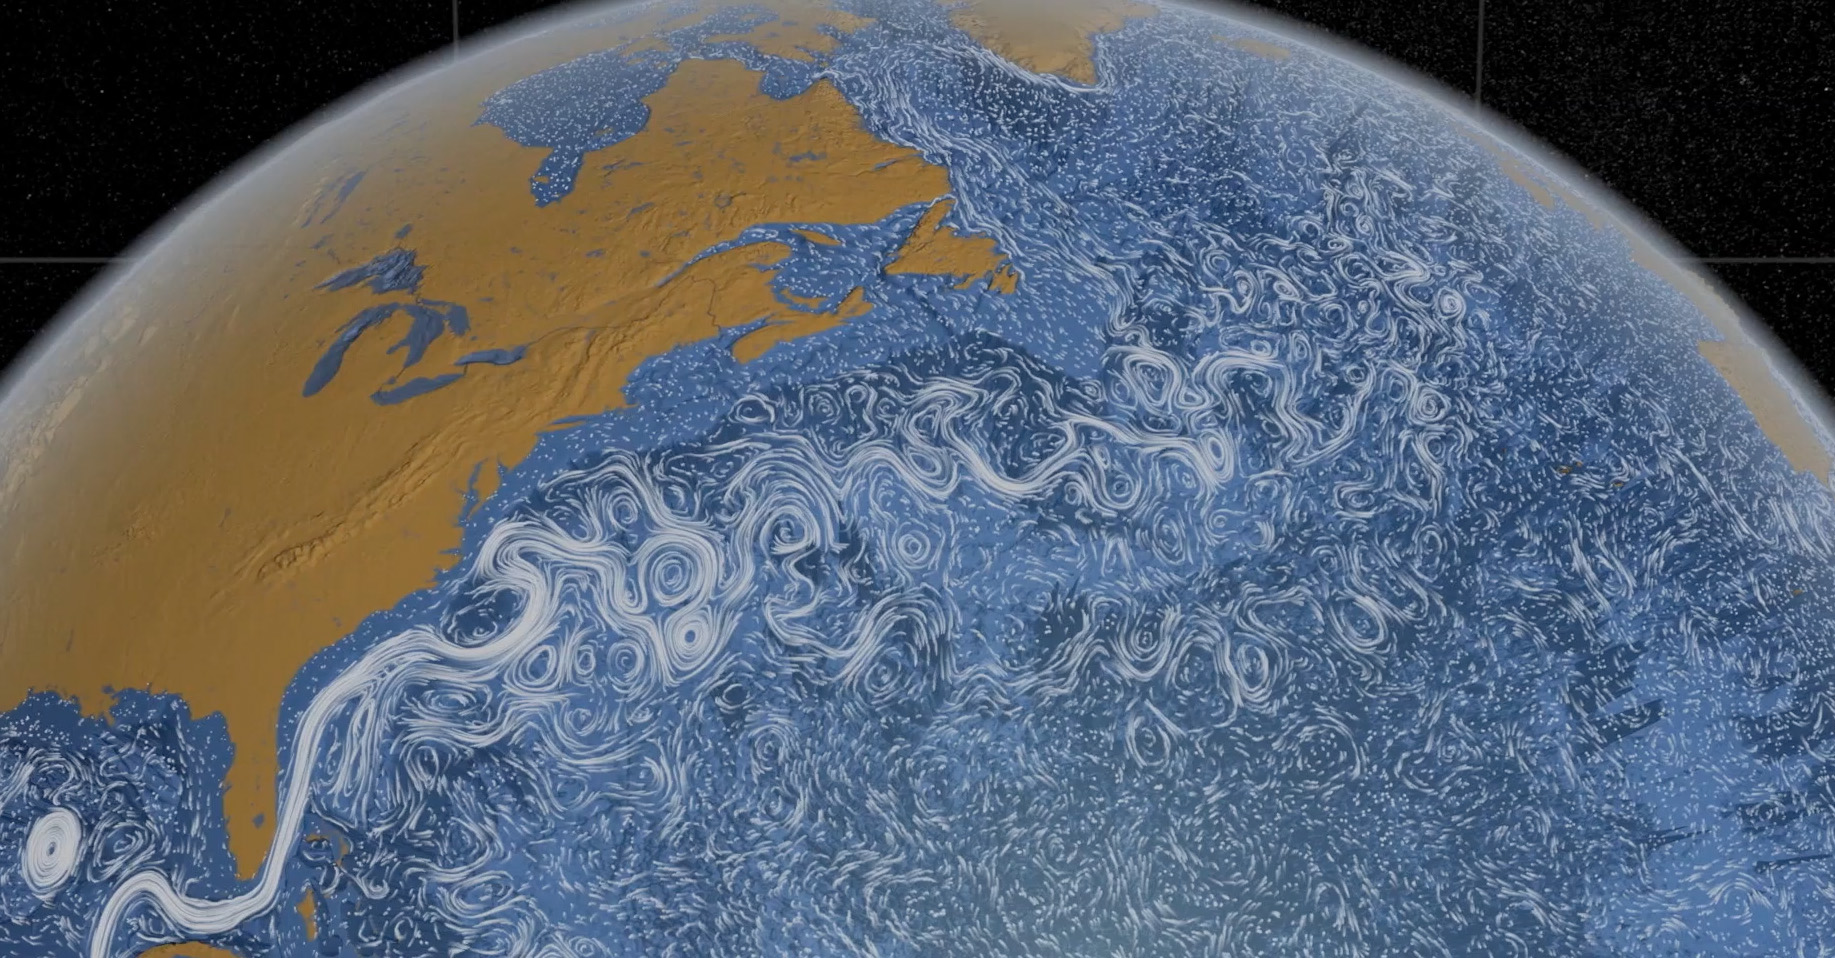
General (ocean and atmosphere) circulation
Week 6
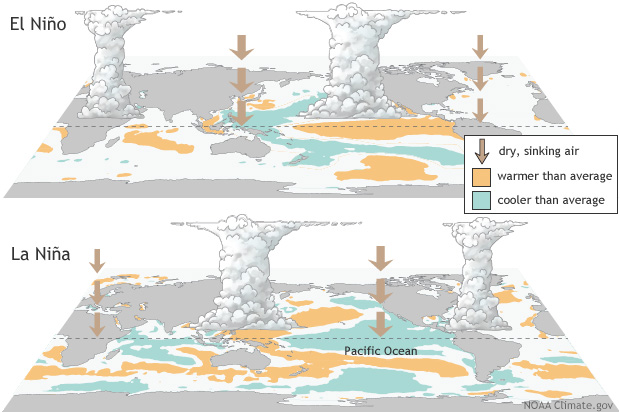
Weather & teleconnections
Week 7
Midterm assessment on theme 1

Theme 2
Earth's climate through time

Data: Lisiecki+Raymo 2004, Fig design: ghe
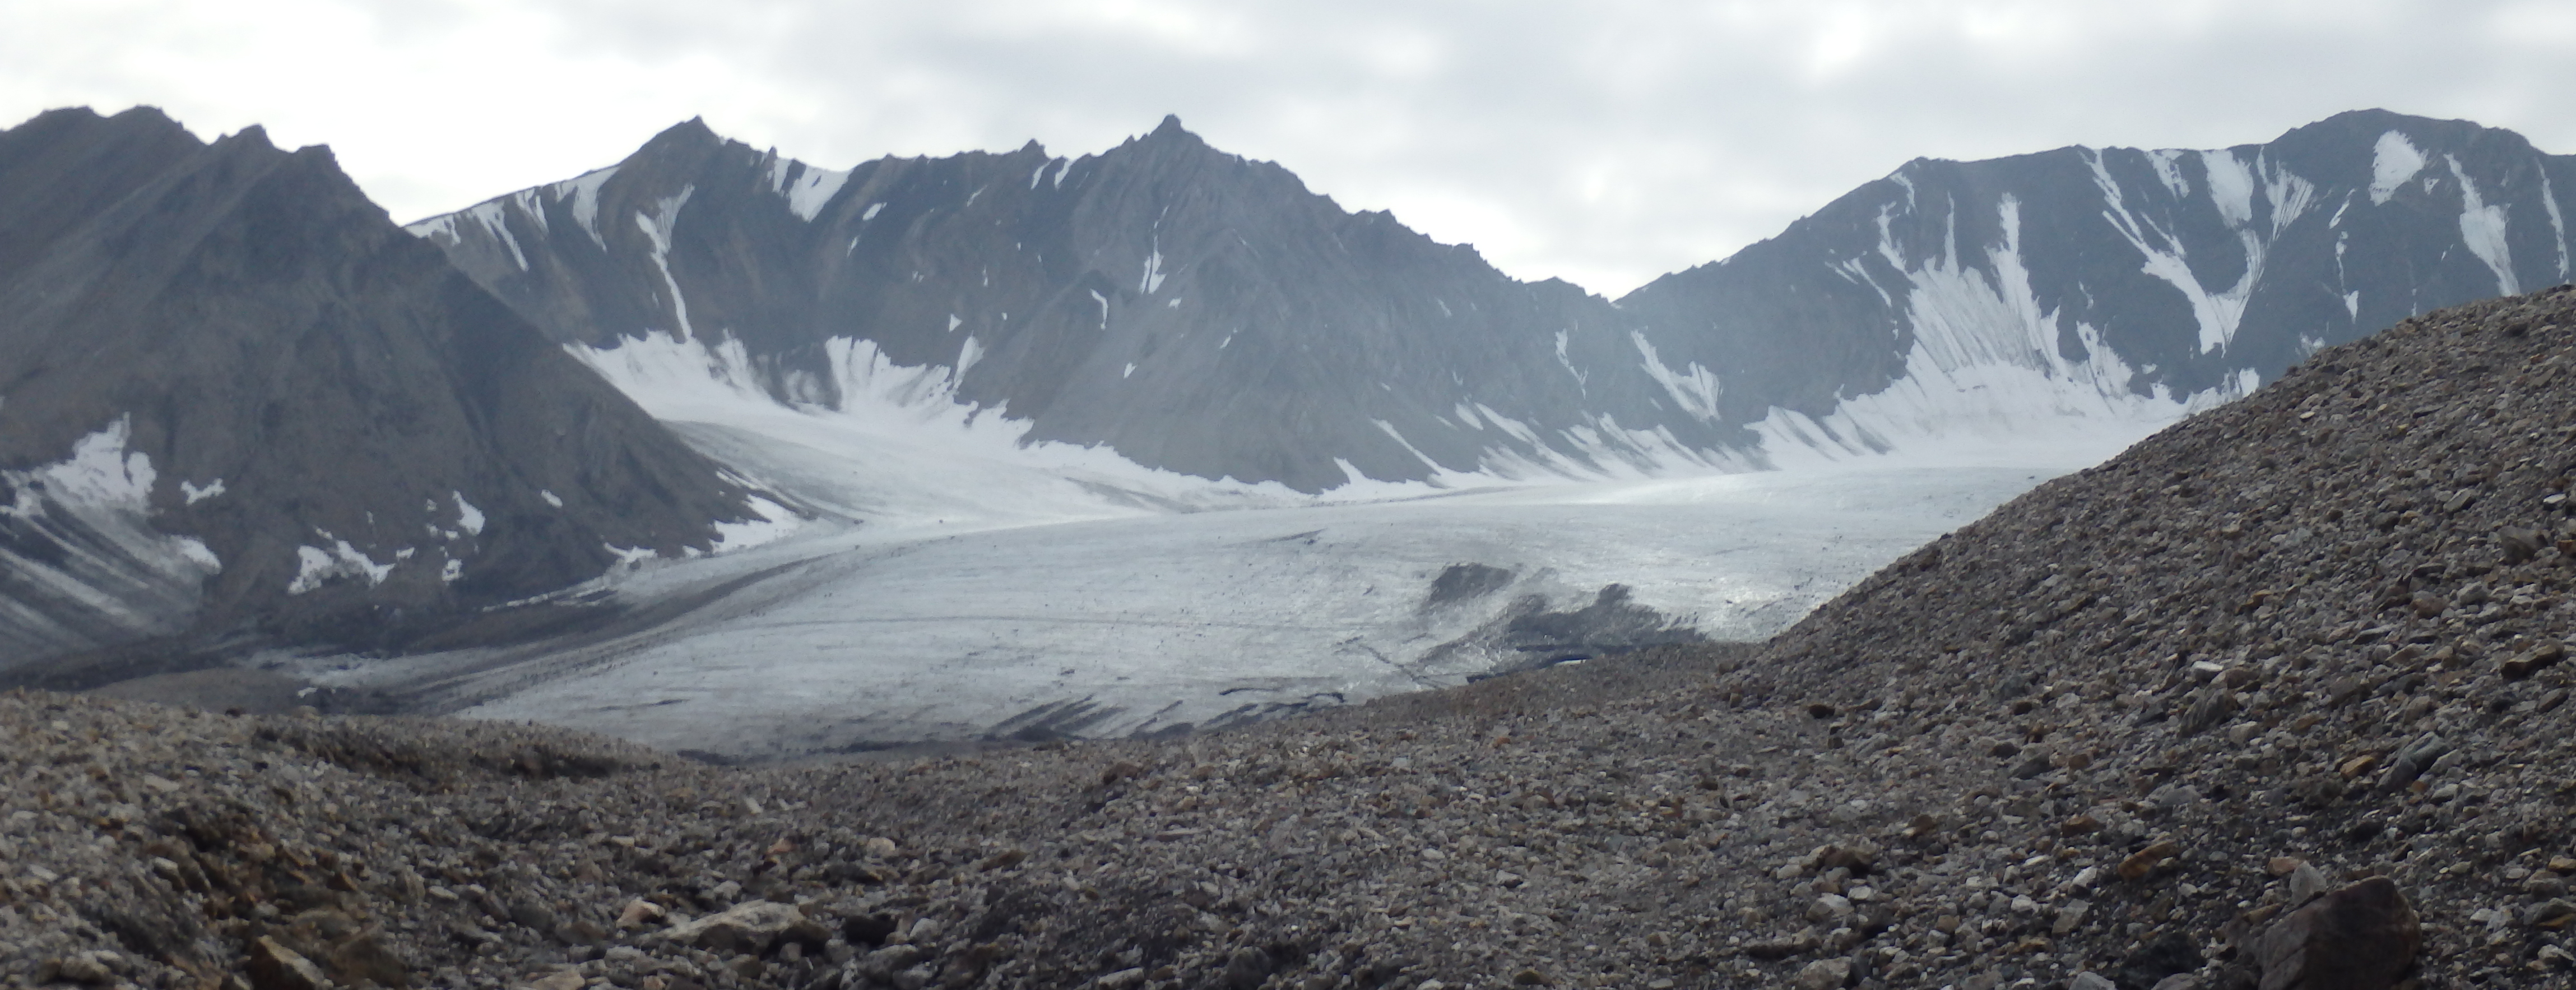
Week 7/8
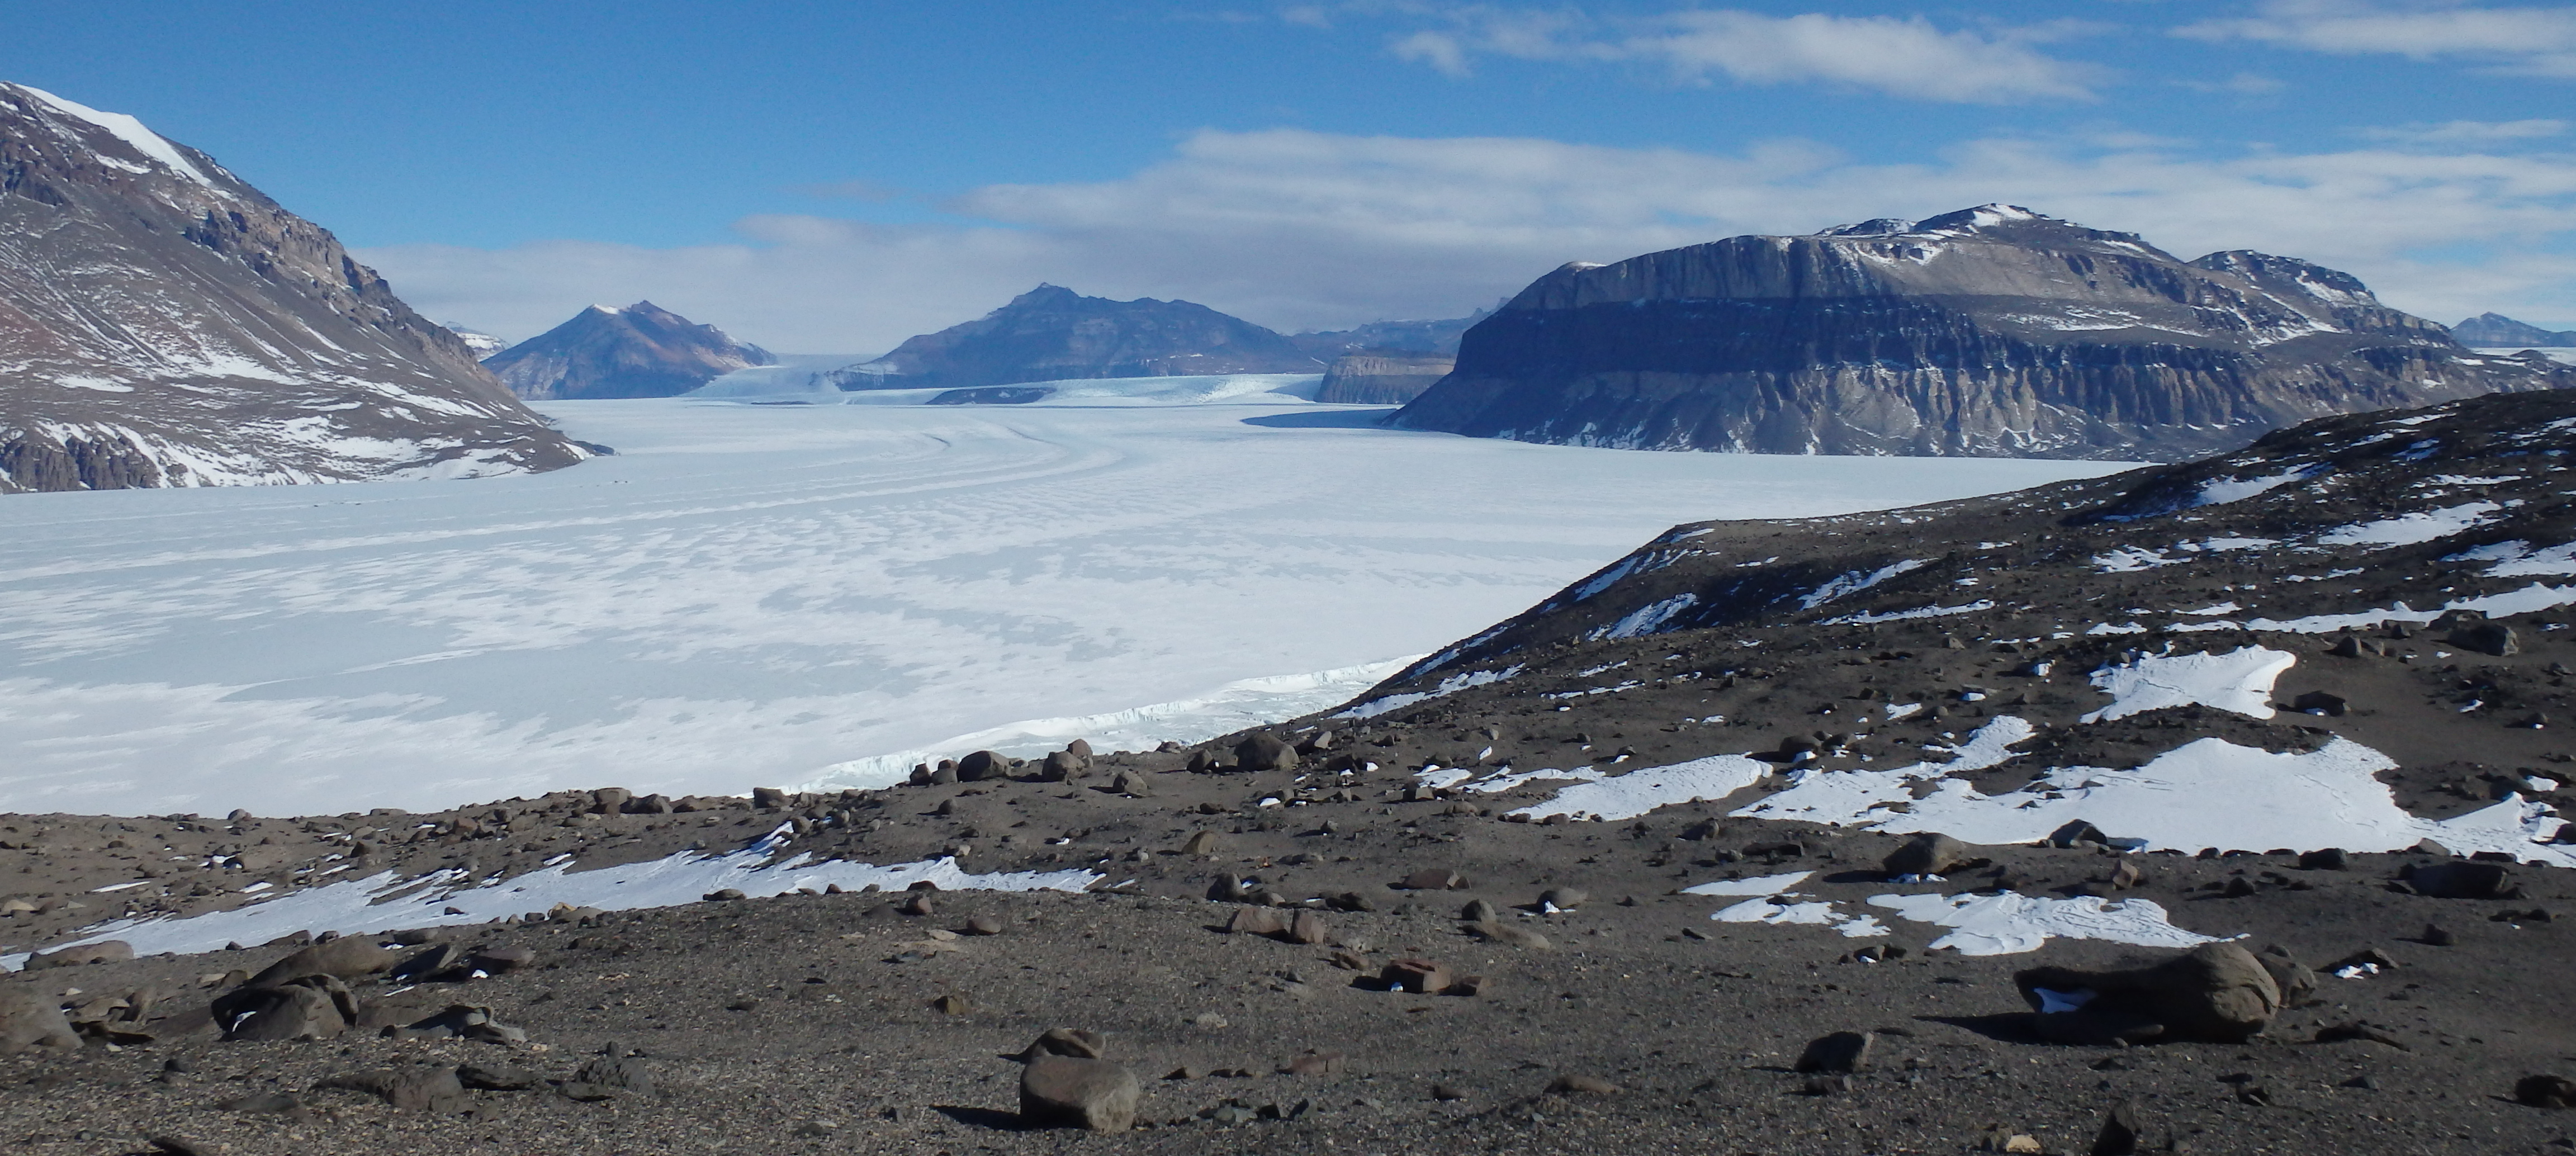
The cryosphere

Image credit: ghe
Week 8/9
Paleoclimatology – tools & techniques
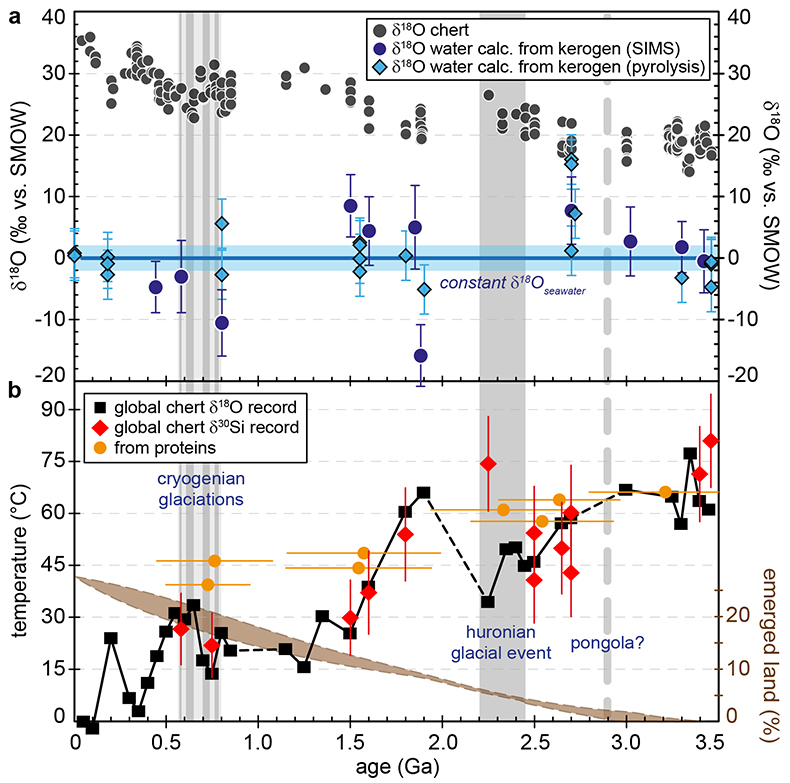
Week 10
Climate history I: Deep Time

Week 11
Climate history II: The Quaternary (2.58 Ma → now)

Week 12
Climate history III: Deglaciation & the Holocene
Week 13
Environmental responses to climate
Midterm assessment on theme 2
Break
No Class
Week 14
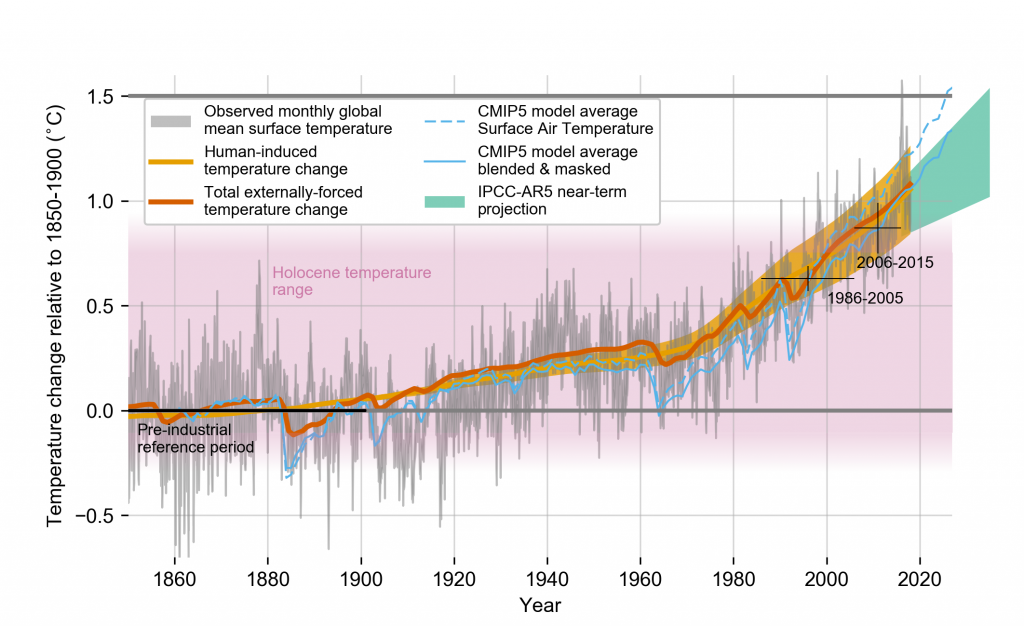
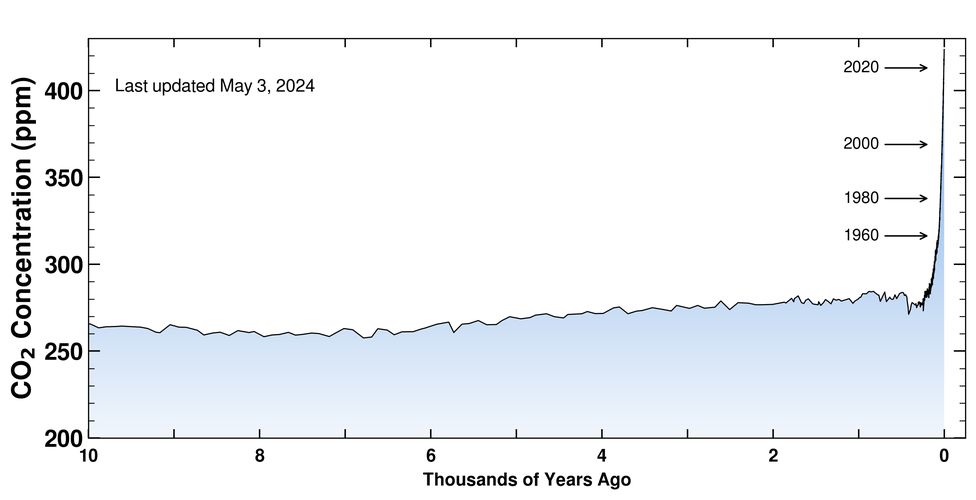
Modern climate change in context

Image: NOAA
Application & evaluation
Practice & participation
Graded on completion
- Problem/practice sets
- In-class activities
- Comprehension checks
etc…
Laboratories
Complete assignments/write-ups due the following Friday, 8 days later.(unless otherwise specified)
Assessments
Midterm I: in-class written exam (1 pg notes)
Midterm II: in-class written essay (open notes)
Final: oral exam
Grading breakdown
| Total | 100% |
|---|---|
| Practice & participation | 30% |
| Laboratories | 40% |
| Assessments (10% each) | 30% |
What is climate (science)?
Why do we care?
Climate & Weather
Let's establish some working definitions
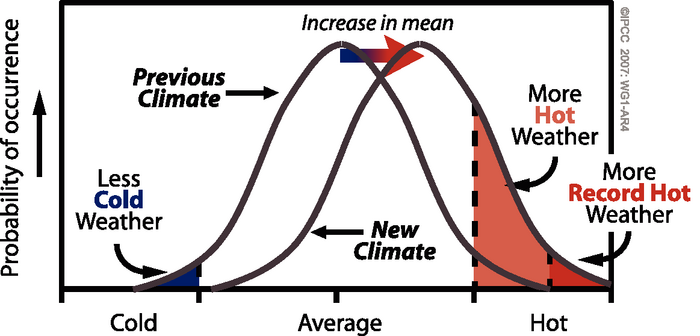
Climate & Weather
Weather
The state of the atmosphere, mainly with respect to its effects upon life and human activities.
American Meteorological Society

Climate & Weather
Climate
Climate in a narrow sense is usually defined as the average weather, or more rigorously as the statistical description in terms of the mean and variability of relevant quantities over a period of time ranging from months to thousands or millions of years. The classical period for averaging these variables is 30 years, as defined by the World Meteorological Organization (WMO). The relevant quantities are most often surface variables such as temperature, precipitation and wind.
Climate and weather processes exist along a continuum.

Scales of climate
- Geographic (space)
- Temporal (time)
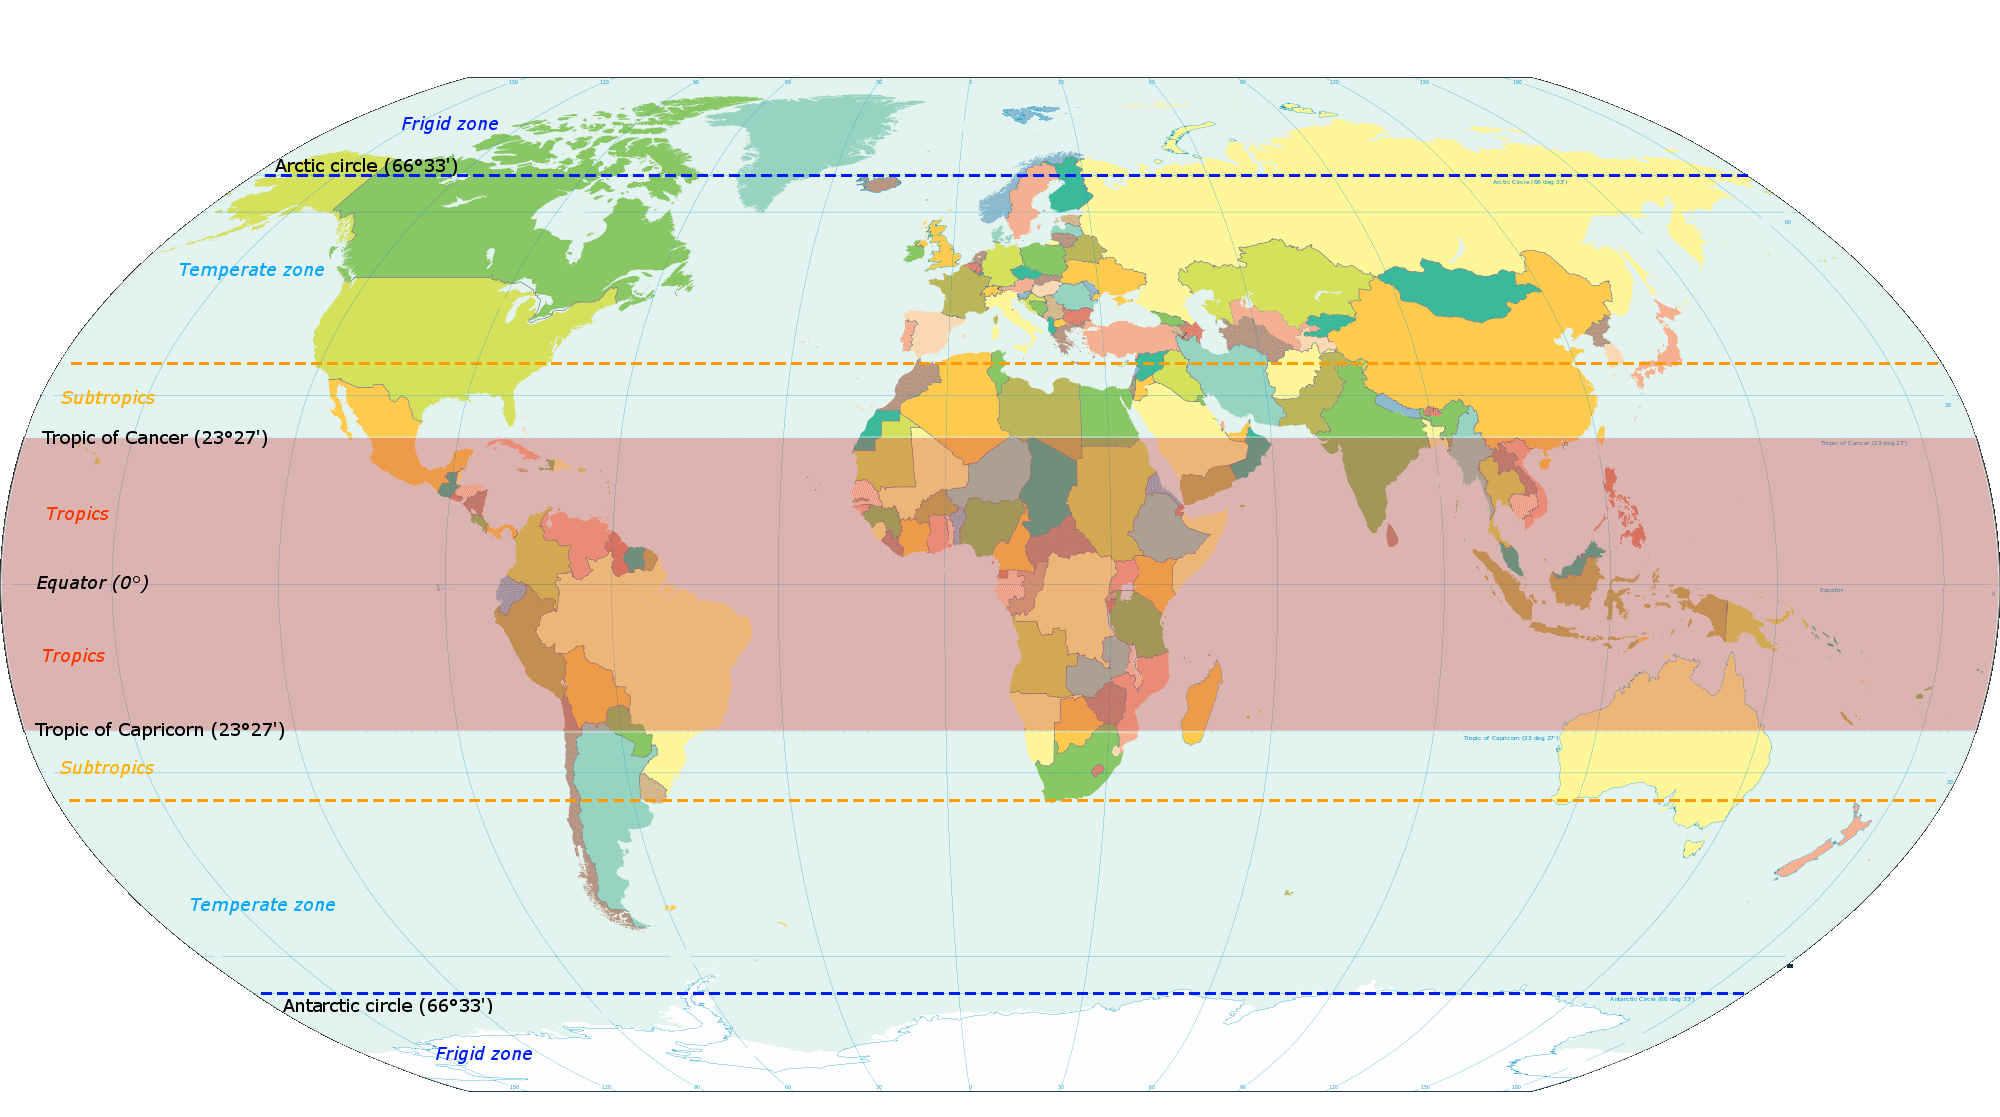
Geographic scales of climate
Geographic zones
Roughly correlate with mean annual temperature
Regional climate zones
Köppen-Geiger climate classification system

| A | Tropical |
| B | Dry |
| C | Moist Subtropical Mid-Latitude |
| D | Moist Continental Mid-Latitude |
| E | Polar |
| H | Highland |
Global distribution of Köppen zones

Temporal scales of climate
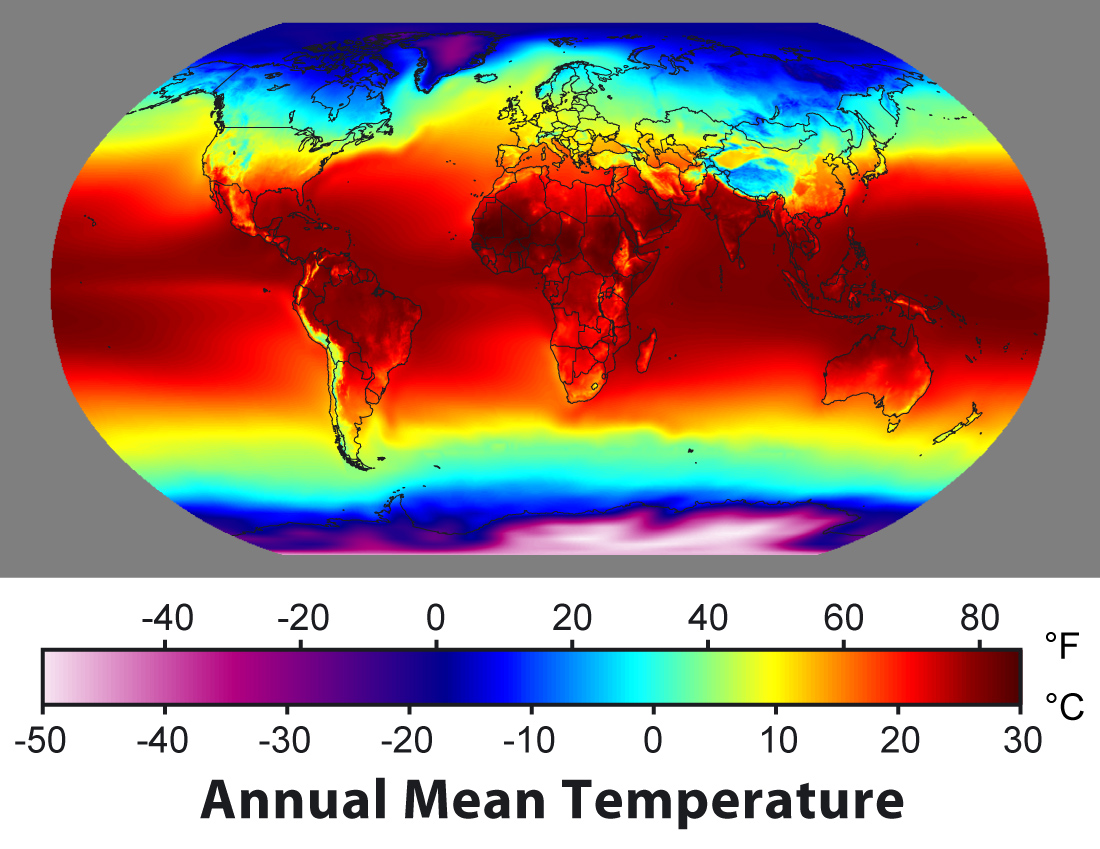
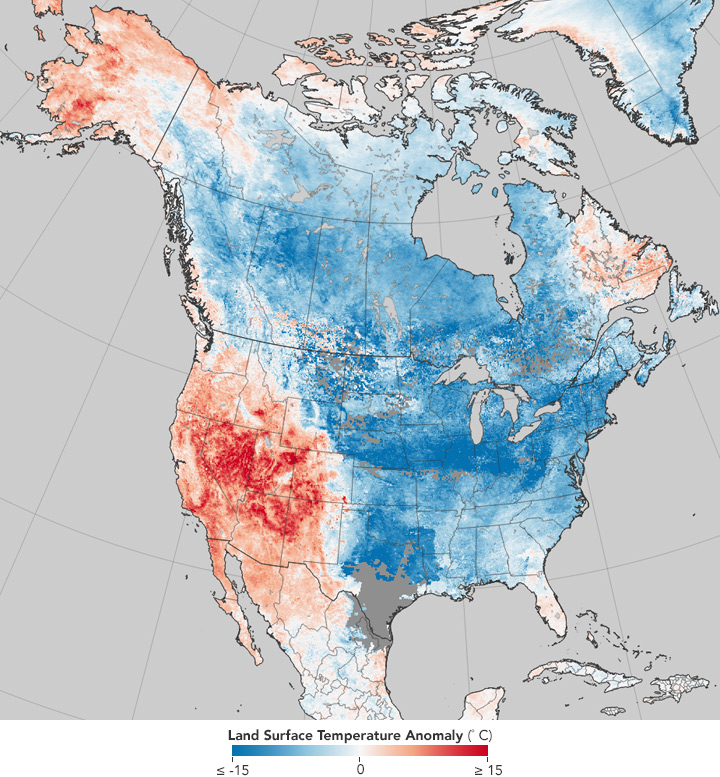
Annual mean temperature
Decadal (10 yr) scale

Centennial (100 yr) scale
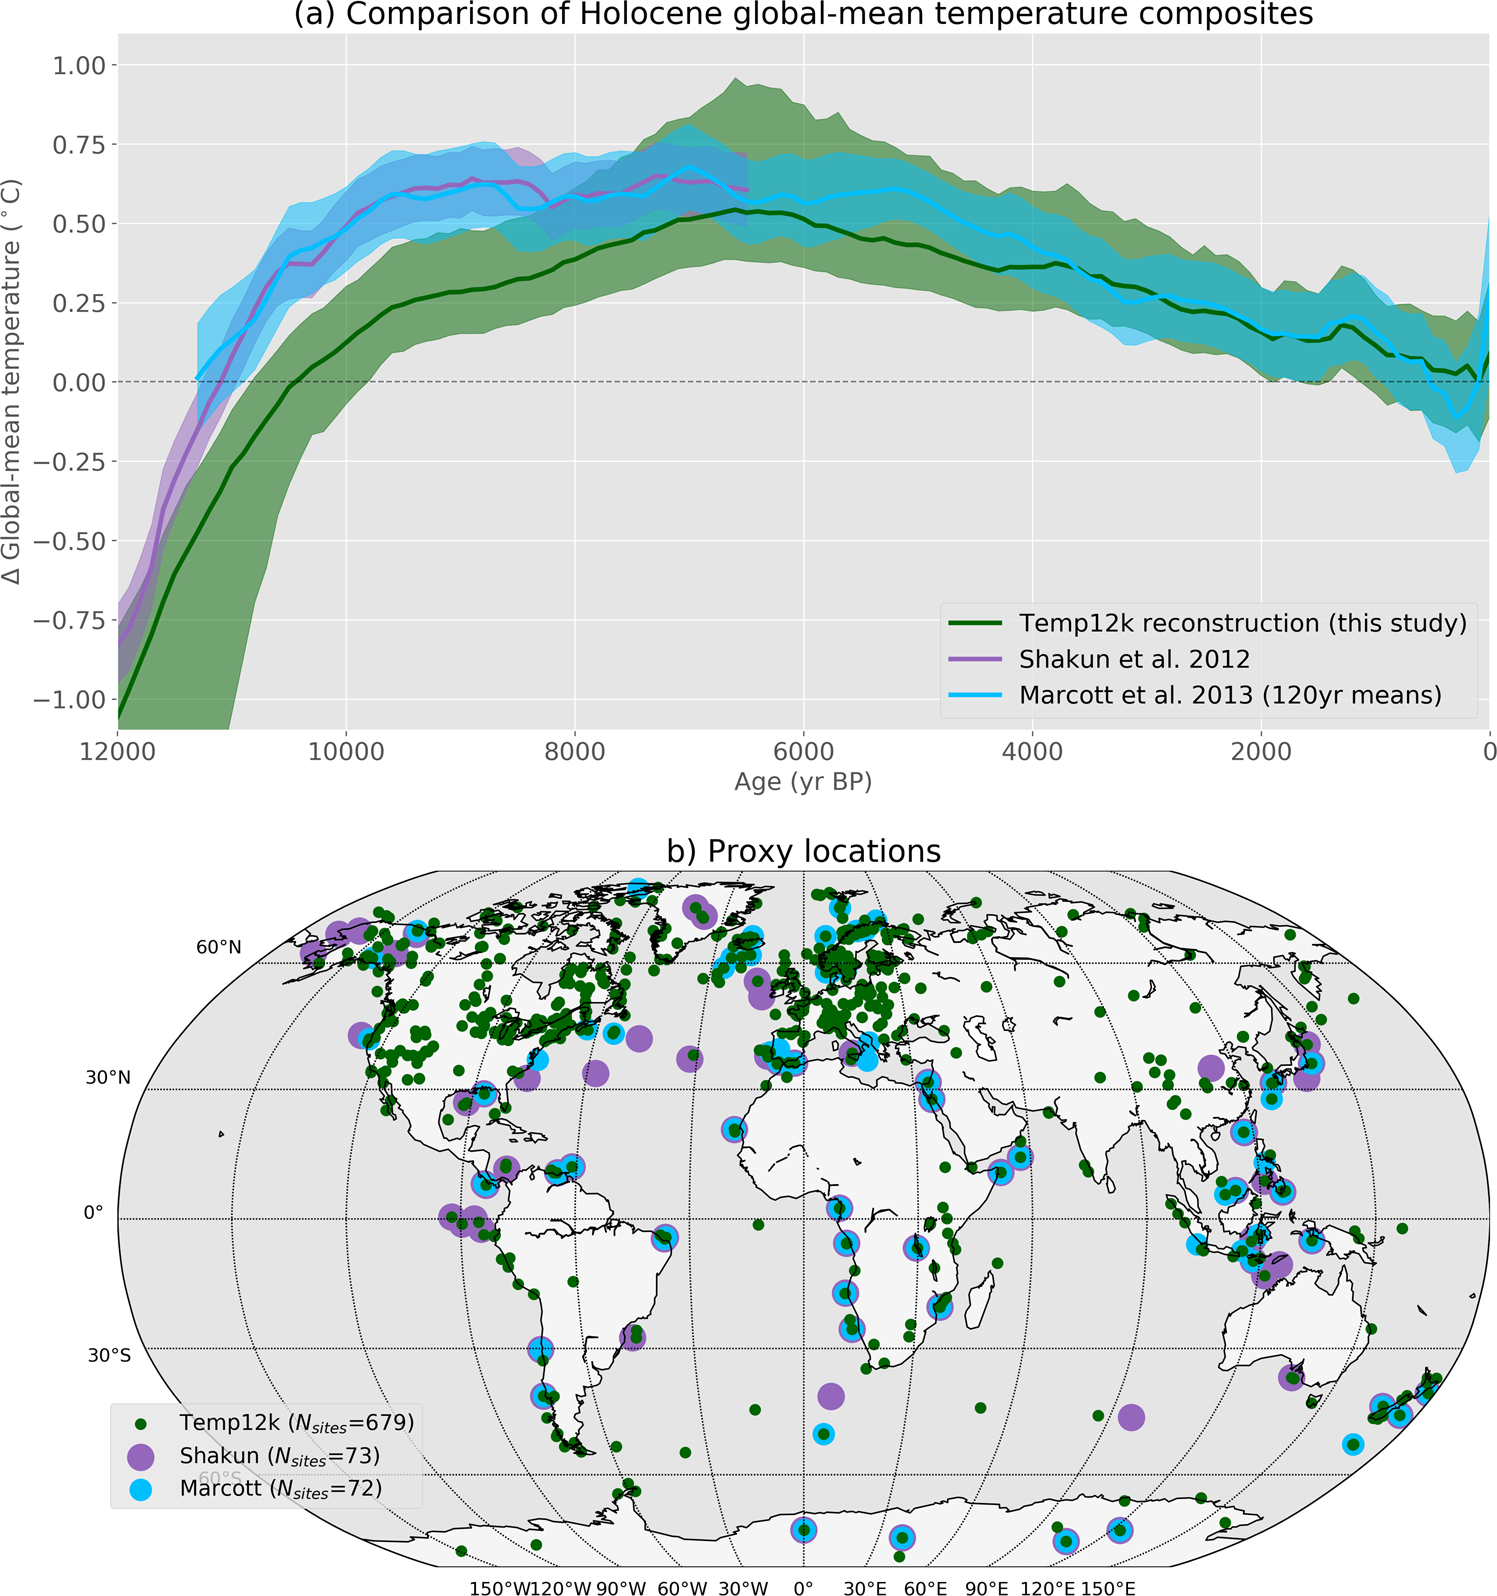
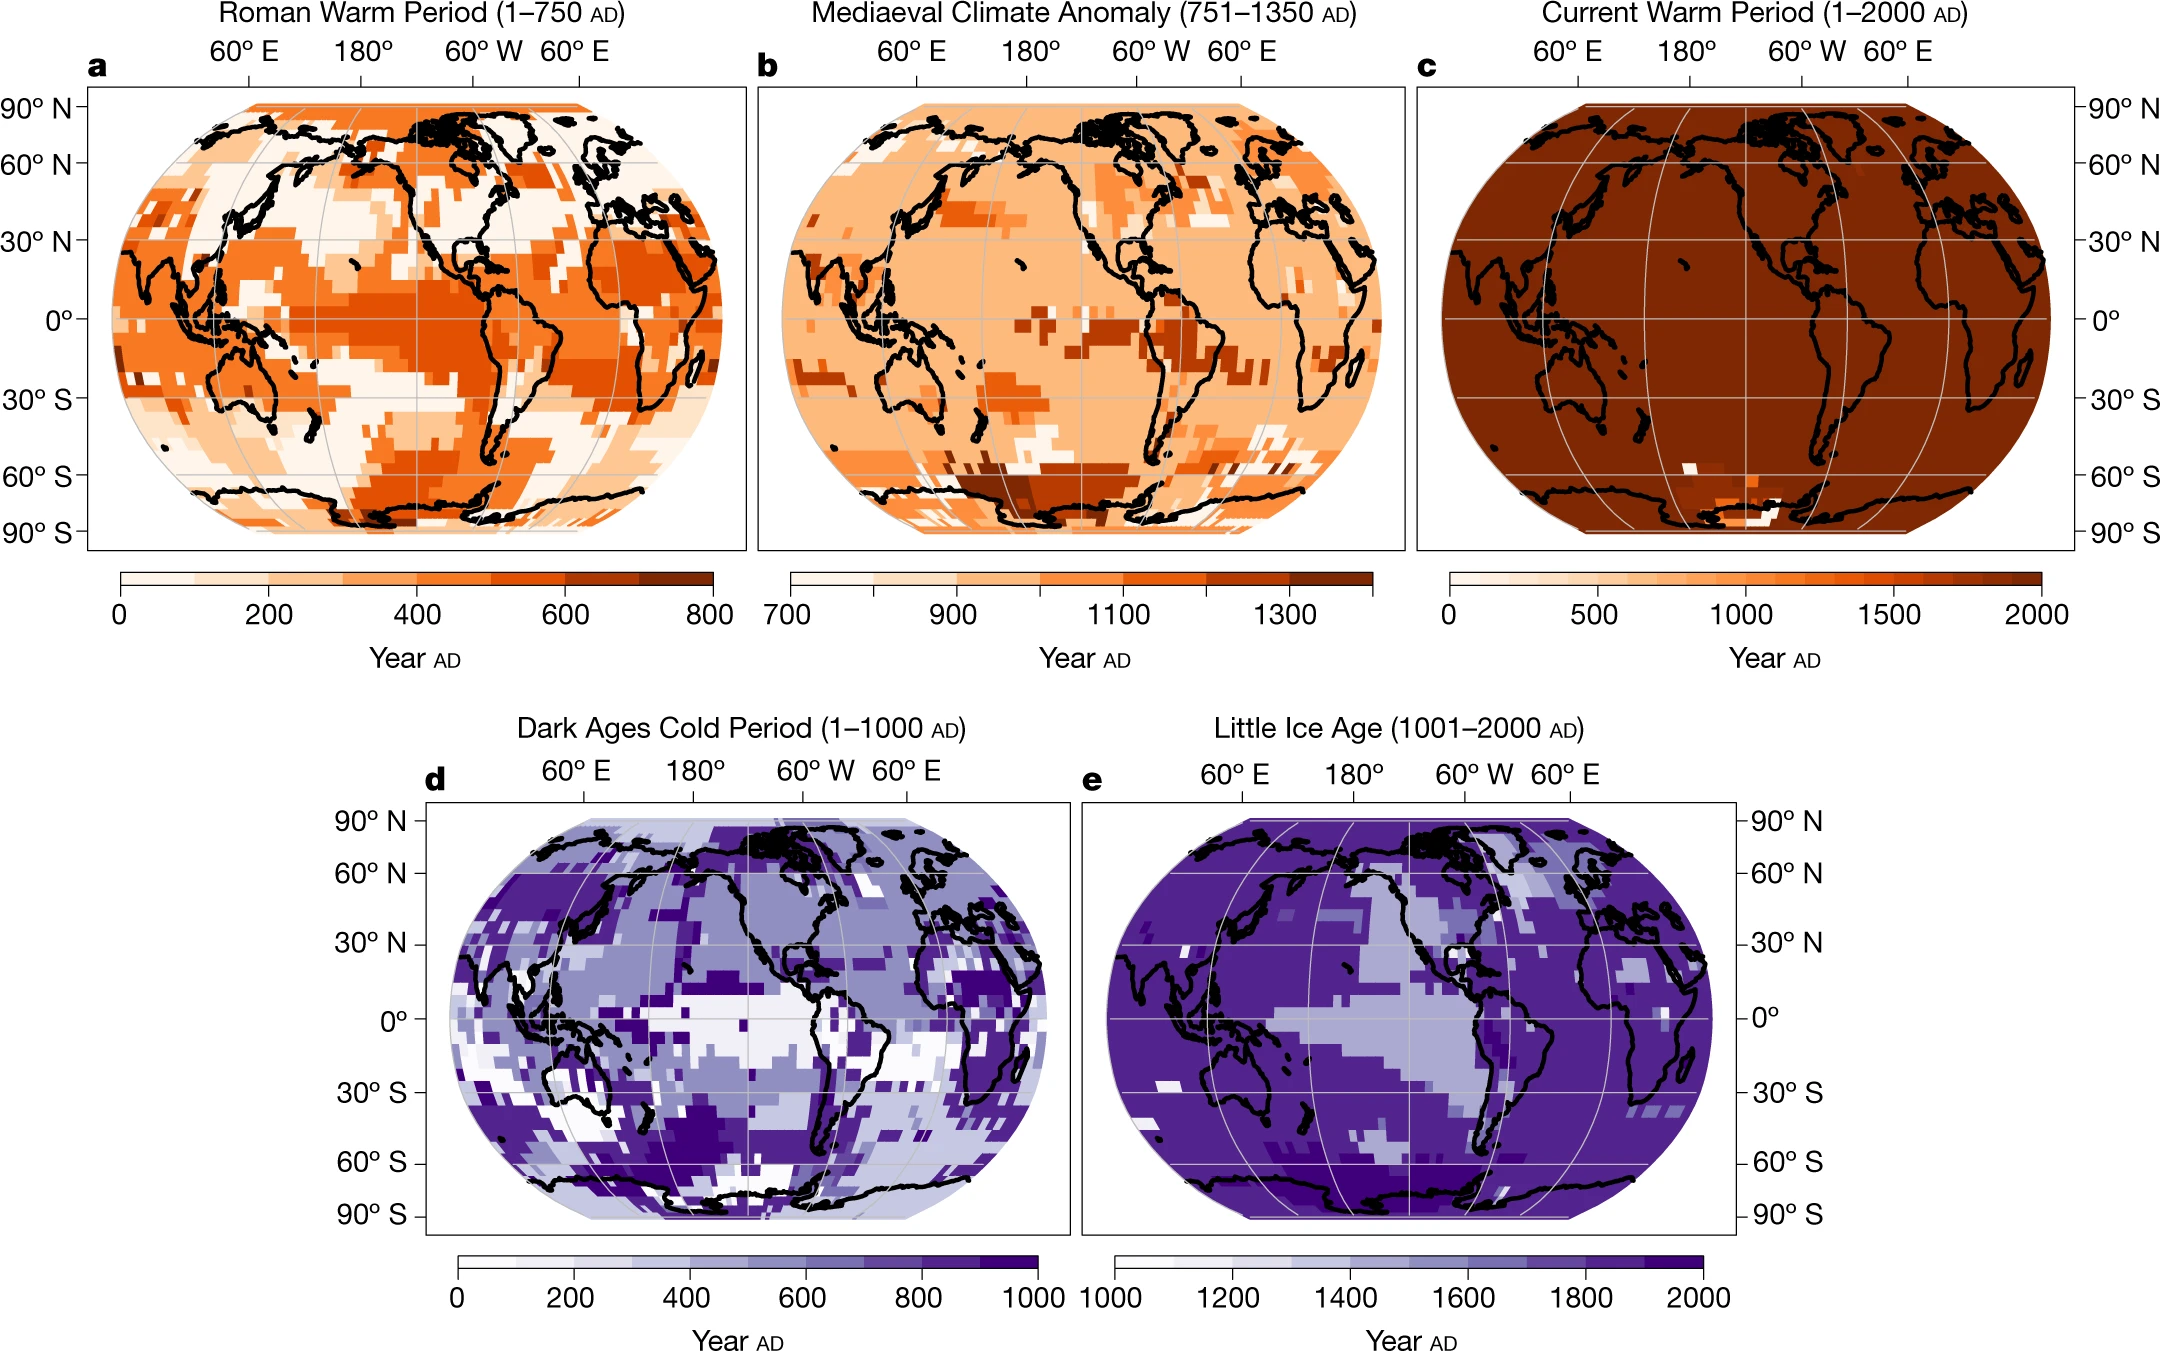
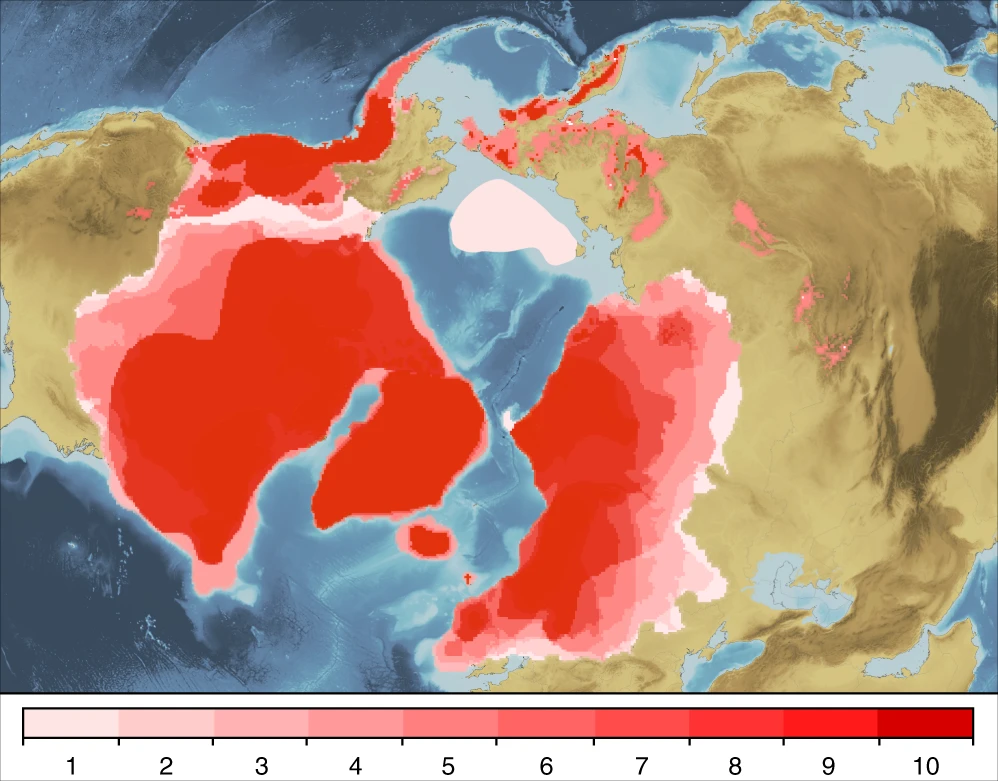
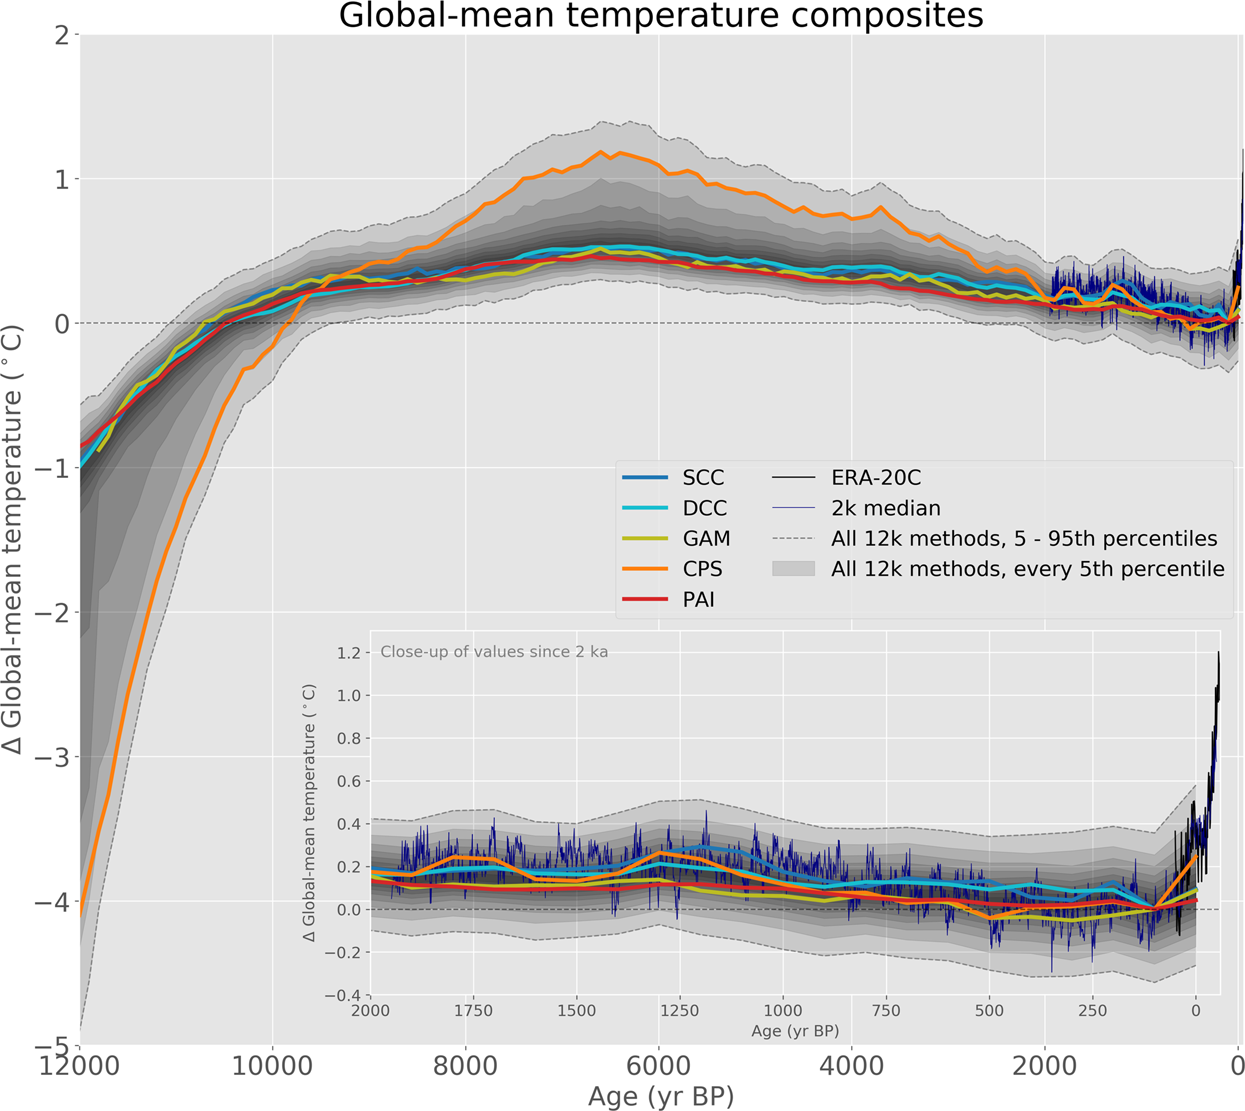
Millenial (1000 yr) scale

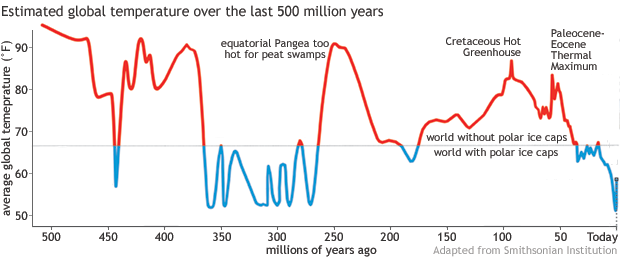
104 yr scale
105 – 106 yr scale
Data: Lisiecki+Raymo 2004, Fig design: ghe
107 yr scale

108 yr scale
109 yr scale
Climate across time and space


